
Source: Kevin Strategy Research
Authors: Liu Gang, Yang Xuanting
At the September FOMC meeting concluded in the early hours of today Beijing time, the Federal Reserve lowered the benchmark interest rate by 25 basis points to 4~4.25%, marking the first rate cut in nine months since last December. Following Powell's unexpected dovish shift at Jackson Hole, two consecutive months of disappointing nonfarm payrolls data, and a moderate rise in August CPI, this rate cut by the Fed was already a highly anticipated consensus in the market, with the “easing trade” having played out for nearly a month. Therefore, apart from the rate cut itself, the focus of this meeting was on the subsequent pace of rate cuts and internal divisions within the Fed after the appointment of new governors.
Chart: Implied probability of a rate cut based on CME interest rate futures before the meeting was 100%
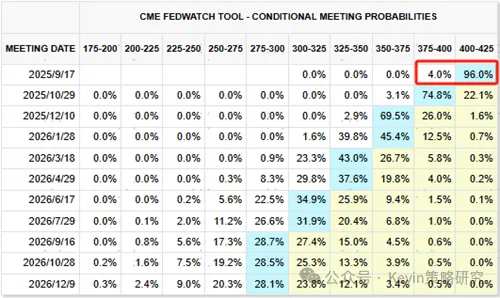
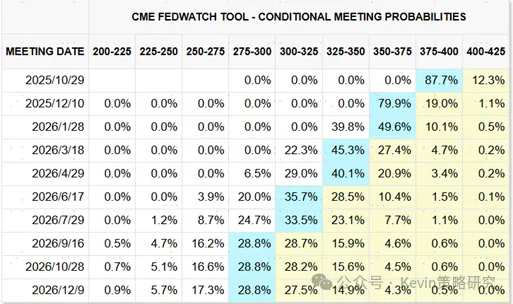
 Chart: Implied probability of an October rate cut based on CME interest rate expectations after the meeting rose to 88%
In terms of outcomes, this meeting can be considered 'moderate,' characterized by the following: 1) a 25-basis-point interest rate cut; 2) Powell described this rate cut as a 'risk-management' rate cut; 3) while mentioning that the cooling labor market requires attention, concerns over continued inflation transmission were still expressed; 4) regarding the future path of rate cuts, the 'dot plot' projected two rate cuts by year-end (but with significant internal divisions, leaving it evenly balanced), which is in line with expectations.
As a result, the market reaction after the meeting was mixed and characterized by 'good news priced in,' with neither shocks nor surprises. U.S. Treasury yields and the dollar rose, gold fell, Nasdaq saw a minor pullback, and the Dow Jones Industrial Average increased, consistent with our guidance in "What Happens After a Rate Cut?".
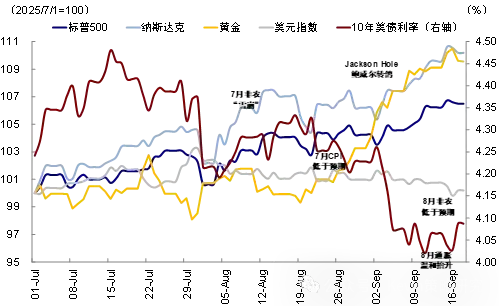
Chart: After the meeting, the 10-year U.S. Treasury yield increased, the U.S. dollar briefly fell before closing higher, and both U.S. stocks and gold experienced minor pullbacks.
The core message of this meeting: A 'risk-control' rate cut as expected, with the dot plot projecting two more rate cuts this year but showing significant divergence.
The 25-basis-point rate cut to 4~4.25% represented a 'risk-management' approach primarily aimed at balancing risks. Powell’s remarks at this meeting were largely consistent with his statements at the Jackson Hole conference in August [1]. He described this rate cut as a 'risk-management' measure: On one hand, acknowledging the weakening labor market while adding the phrase 'downside risks to employment have risen'; on the other hand, still highlighting inflation risks, with wording that included 'inflation has moved up.' During the press conference, he also mentioned that the pass-through effect of tariffs on inflation would continue until next year, although the transmission to consumers was much slower than expected—a point consistent with our calculations ("Who Actually Bears the Tariff Costs?"). Overall, the message from this meeting is that the balance between employment and inflation is indeed tilting towards employment, but not overwhelmingly so.
The 'dot plot' suggests there will be two more rate cuts this year and one in 2026, but with considerable divergence. Changes among voting members have increased market attention on the 'dot plot' and the Federal Reserve's independence. Stephen Miran, an economic advisor to Trump, officially joined the Fed as a governor on September 15 [2], while the dismissal of Lisa Cook was temporarily blocked by a federal court [3], allowing both to participate in this meeting’s vote. Regarding the 25-basis-point rate cut in September, only Miran cast a dissenting vote, alleviating market concerns about the Fed’s independence.
However, divisions over the future rate-cut path have significantly widened: 1) On the surface, the 'dot plot' indicates two more rate cuts this year, but examining the voting distribution among the 19 members reveals that nine expect one or fewer rate cuts this year, nine project two more cuts, and one forecasts an additional 125-basis-point cut (clearly unlikely, with speculation it may be Miran). In other words, if not for Miran’s extremely low projection pulling down the average, the median-based 'dot plot' would suggest an almost even split between one and two more rate cuts this year—matching closely with current futures market expectations pricing in over 80% probability of cuts in both October and December.
2) The divergence for 2026 is even greater, with the median indicating just one rate cut, significantly fewer than the three cuts currently priced into the futures market. However, since next year involves Powell’s term renewal and the rotation of several committee members, the market has not overreacted to the projected path for next year.
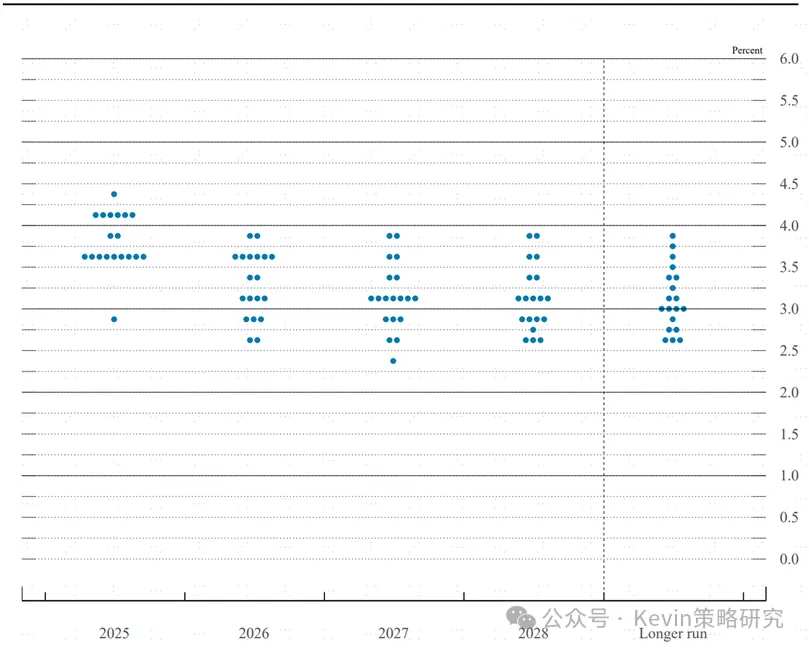
Chart: The September FOMC 'dot plot' shows two more rate cuts projected within 2025.
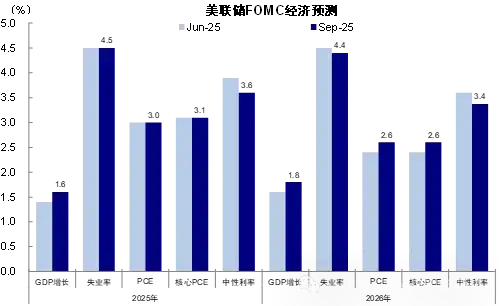
Slight adjustments to economic forecasts indicate no concerns about growth and inflation pressures in 2026. This FOMC made minimal adjustments to economic data compared to June, slightly raising growth forecasts for 2025 and 2026, slightly lowering unemployment rate projections for 2026, and increasing inflation projections for 2026, suggesting the Federal Reserve is not worried about growth and inflation pressures in 2026.
Chart: September FOMC economic forecast raises real GDP growth for 2025; unemployment and inflation forecasts remain unchanged from June.
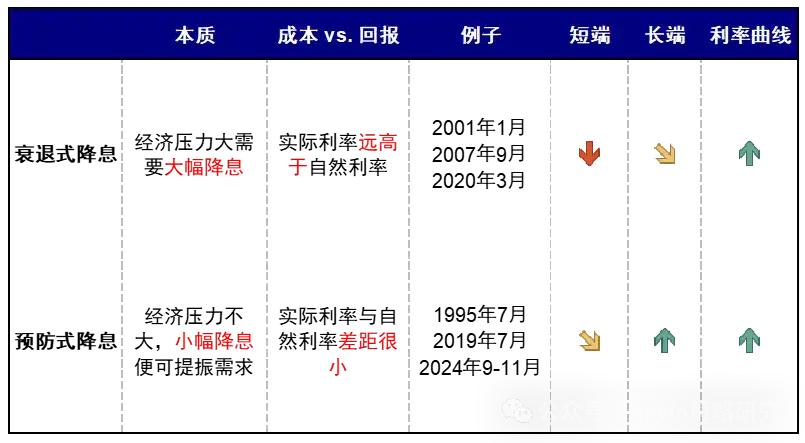
How much further can future cuts go? 'Preventive' rate cuts don’t require many moves, and the cycle tends to be shorter; the key issue next year will be the Federal Reserve's independence.
Whether it is a 'preventive' rate cut or a 'risk-control' one, both imply that the Federal Reserve is temporarily unwilling to commit and does not believe there is a need for continuous and numerous rate cuts.
Chart: Rate-cut cycles are divided into recession-driven rate cuts and preventive rate cuts.
Although we have been more optimistic than the market regarding whether interest rate cuts would commence, the past two months have borne this out ("Is the Fed Close to the Next Rate Cut?"). However, we are not aggressive about the magnitude required in this easing cycle. Aside from unresolved inflation concerns that worry the market, a modest rate cut could address most of the current pressures on U.S. growth, thus eliminating the need for substantial reductions.
1) The current economic situation is not particularly weak but rather characterized by divergence, with rate cuts expected to boost traditional demand. The extent of weakening growth determines the magnitude of rate cuts; however, the U.S. economy is currently not in bad shape. Retail data released before the meeting showed an unexpected 0.6% month-over-month increase in August, marking the third consecutive month of growth. This further demonstrates that the U.S. growth slowdown, driven by structural divergence, remains far from a recession. In contrast to consistently robust AI investment, the divergence within the U.S. economy is evident in traditional manufacturing and real estate sectors that have been persistently affected by high interest rates. These two areas are expected to recover gradually after rate cuts, combined with fiscal stimulus at the start of the new year and already strong AI investment. We anticipate these factors will help drive an economic recovery in the U.S.
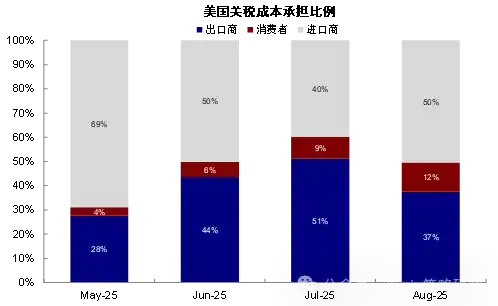
2) Inflation is still trending upward, albeit slowly. Unlike previous "precautionary" rate cuts, inflation remains on an upward trajectory due to tariff impacts. The transmission of tariffs to consumers continues, with August inflation data indicating that the proportion of tariffs borne by consumers has slightly increased from 8~10% during April-July to around 12% ("Who Bears the Cost of Tariffs?"). Additionally, base effects from Q4 inflation risks may compress the room for rate cuts once fundamentals improve. Our estimates suggest that year-over-year CPI will peak at 3.2% by the end of the year before gradually declining, while core CPI will slow its pace after reaching 3.4% year-over-year by the end of the year.
Chart: We expect year-over-year CPI to reach 3.2% by the end of the year, gradually peaking and then declining; year-over-year core CPI at 3.4%.
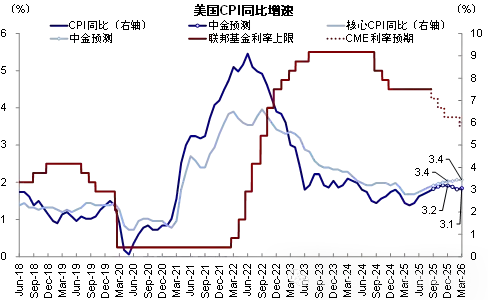
Chart: August inflation data shows that the proportion of tariffs borne by consumers has risen from 8~10% during April to July to around 12%.
Under a 'natural scenario,' we estimate that the theoretical required space for this round of Fed rate cuts is 100 basis points, consistent with the current 'dot plot,' corresponding to a long-term US Treasury yield of 3.9% to 4.1%. The current difference between the actual interest rate and the natural interest rate in the United States is 0.9%. Four rate cuts of 25 basis points each to 3.25%-3.5% would be sufficient to balance financing costs with return on investment, corresponding to a nominal neutral interest rate of 3.6%. Assuming a term premium of 30-50 basis points, this corresponds to a 10-year US Treasury yield of 3.9% to 4.1%.
However, the biggest variable is the independence of the Fed next year, which is also why the market did not react strongly to the 2026 'dot plot.' If Trump further interferes in FOMC decisions through personnel appointments, there is a certain probability that the Fed, which should not have cut rates multiple times, might intensify rate cuts, bringing risks of asset and economic 'overheating.' This 'dot plot' also reflects growing divisions.
Asset implications? From 'easing trades' to 'recovery trades'; US Treasuries and gold will initially strengthen before weakening, while the US dollar will weaken first and then strengthen; equities should be bought on pullbacks, with cyclical sectors catching up with technology; China's market focuses on fundamental structural opportunities and Sino-US reflection opportunities.
Considering the middle-of-the-road tone of this meeting, the future path of rate cuts has neither exceeded expectations nor reached consensus, and the market and various assets have already priced in substantial rate cut expectations. Therefore, we expect that in the short term, the 'easing trade' that has persisted for nearly a month may pause (falling rates, weak dollar, rising gold, growth and emerging markets leading). This aligns with our judgment in 'What Happens After Rate Cuts?' as reflected last night in the reaction of the US stock market and major assets.
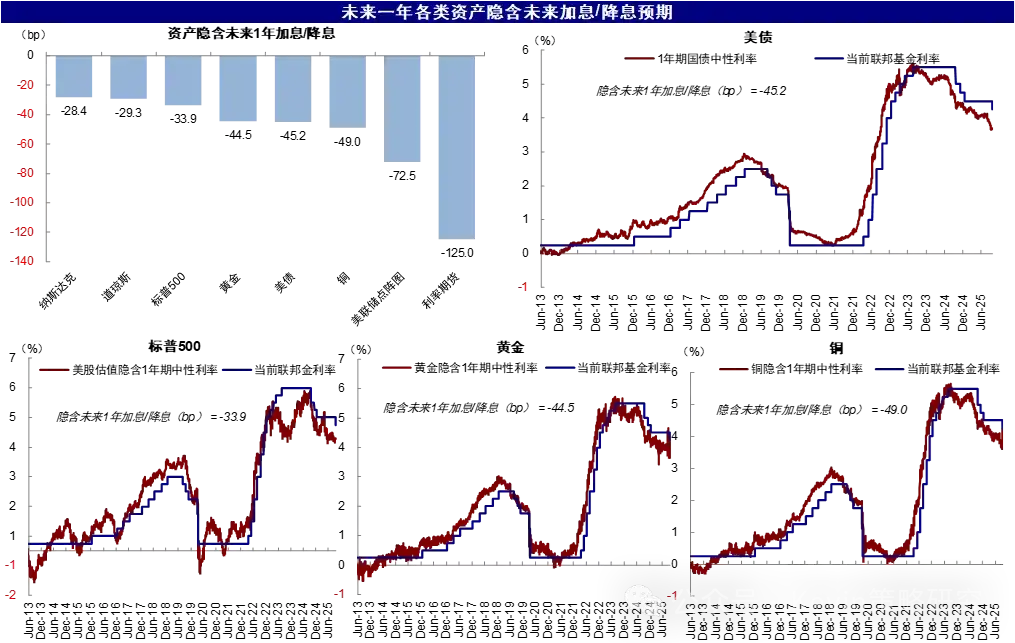
From the perspective of rate cut expectations priced into various assets over the next year: interest rate futures (5 times) > Fed dot plot (2.9 times) > copper (2 times) > US Treasuries (1.8 times) ≈ gold (1.8 times) > S&P 500 (1.4 times) > Dow Jones (1.2 times) > Nasdaq (1.1 times). This implies that long-term yields, copper, and gold have priced in higher rate cut expectations, whereas US equities have priced in fewer rate cut expectations.
Chart: The ranking of rate cut expectations currently priced into various assets is as follows: interest rate futures (5 times) > Fed dot plot (2.9 times) > copper (2 times) > US Treasuries (1.8 times) ≈ gold (1.8 times) > S&P 500 (1.4 times) > Dow Jones (1.2 times) > Nasdaq (1.1 times).
What the market needs to observe next: 1) September’s nonfarm payroll and inflation data to see whether they strengthen or weaken the probability for October or even next year; 2) Interest-rate-sensitive growth data such as real estate sales and manufacturing PMI over the next one to two months. If these improve, 'recovery trades' may gradually take the lead (rates and the dollar stabilize or even rebound, gold corrects, and emerging markets may diverge due to differences in their fundamentals). In 'What Happens After Rate Cuts?', we found that under 'precautionary' rate cuts, there is generally a switch from 'easing trades' to 'recovery trades' within 1-3 months.
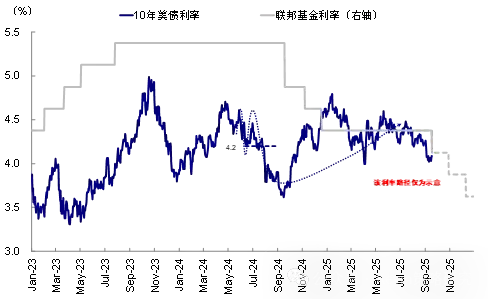
US Treasuries: Expectations are fully priced in the short term, with a central range of 3.9% to 4.1%, initially strong then weakening, and initially longer-duration bonds followed by shorter-duration ones. Given that long-dated bonds have already priced in significant easing expectations, Fed rate cuts do not necessarily mean a sustained and substantial decline in long-term rates. For instance, during the initial rate cuts in September 2024 and in 2019, US Treasury yields bottomed out and subsequently rose during the rate-cut period. We estimate that four rate cuts in this cycle correspond to a 10-year US Treasury yield central range of 3.9% to 4.1%. It is advisable to hold in the short term until rate cut expectations are fully realized and effects materialize, shifting from long to short duration bonds.
Chart: 10-Year US Treasury Yield Range 3.9%~4.1%; Rallies Present Re-allocation Opportunities
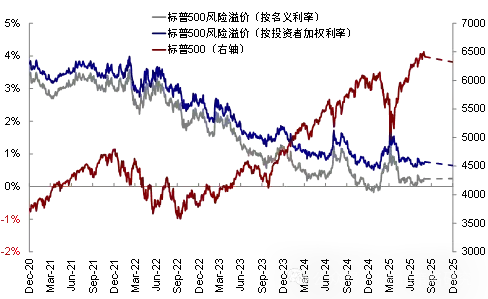
► U.S. stocks: Optimistic scenario S&P 6700, pullbacks provide better entry opportunities; cyclicals and technology sectors remain favorable. We previously raised our U.S. stock target to a baseline scenario of 6200-6400 and an optimistic scenario of 6700 (Why Can the U.S. Equity Risk Premium Be So Low?), and the market is now moving toward our optimistic target. Looking ahead, Fed rate cuts, along with an expected improvement in fiscal impulses in the new fiscal year starting October, may drive a recovery in the credit cycle. Combined with recent upward revisions in earnings expectations, these factors remain supportive for U.S. equities, and pullbacks could present better buying opportunities. Sector-wise, we recommend focusing on technology (initial liquidity boost + continued acceleration in AI-related capital expenditures) and cyclical sectors (which may gradually catch up after rate cuts).
Chart: Base Case S&P 500 Range 6200~6400, Optimistic Target 6700; Pullbacks Provide Better Buying Opportunities
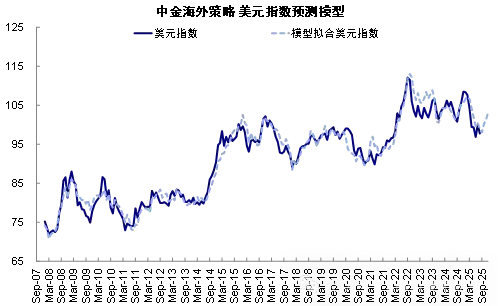
► U.S. Dollar: Weakness first, then strength, with potential for a modest rebound as fundamentals improve. Historically, the dollar has strengthened after each round of 'preemptive' rate cuts. We believe that if this round of rate cuts can quickly spur demand improvement and fundamental recovery, the dollar also has a basis for modest strengthening. Our U.S. dollar liquidity model indicates that the dollar will continue to fluctuate in the short term, with potential for a slight recovery by the end of the year.
Chart: Our U.S. dollar liquidity model shows that the dollar will fluctuate in the second half of the year, with potential for recovery in the fourth quarter.
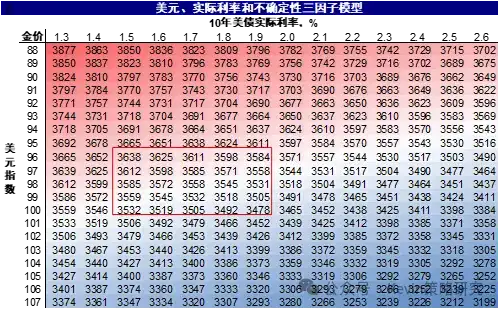
Gold: Asymmetric upside and downside risks make it suitable for holding; however, there is a short-term risk of pullback and rotation into copper after the interest rate cut. Our three-factor model based on the US dollar, real interest rates, and uncertainty suggests that if uncertainty remains at the average level since the Russia-Ukraine conflict, the fair price range for gold corresponding to the current US dollar index (98) and real interest rate (1.7%) would be approximately USD 3,400-3,600 per ounce. The long-term uptrend in gold remains intact, but the majority of the near-term gains may occur ahead of the interest rate cut, with some pullback risks one month after the cut.
Chart: The fair price range for gold corresponding to the current US dollar index (98) and real interest rate (1.7%) is approximately USD 3,400-3,600 per ounce.
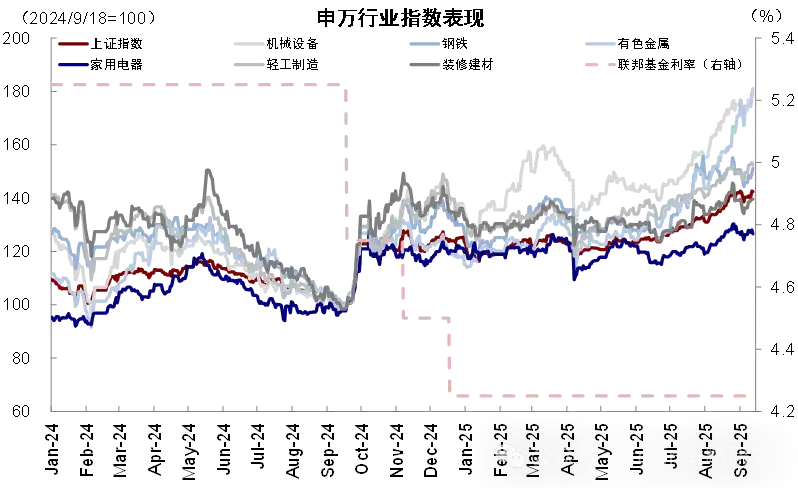
China Market: In the short term, liquidity support may favor small-cap and growth stocks. However, if domestic policies fail to reinforce this trend, greater attention should be paid to fundamentally supported sectors and opportunities linked to the China-US correlation. Given the already optimistic market sentiment, investors can focus on: 1) Sectors aligned with the China-US correlation chain, such as computing power, robotics, and Apple supply chain in technology, as well as tools, home improvement, furniture, and appliances related to the US housing market post-interest rate cut, and machinery and non-ferrous metals tied to investment (refer to 'H-share Trading Strategy under Current Market Conditions'); 2) Sectors showing fundamental improvements, including internet, technology hardware, consumer electronics, innovative pharmaceuticals, non-ferrous metals, and non-bank financials.
Chart: For the China market, rate cuts are not a decisive factor; domestic fundamentals have a greater impact.
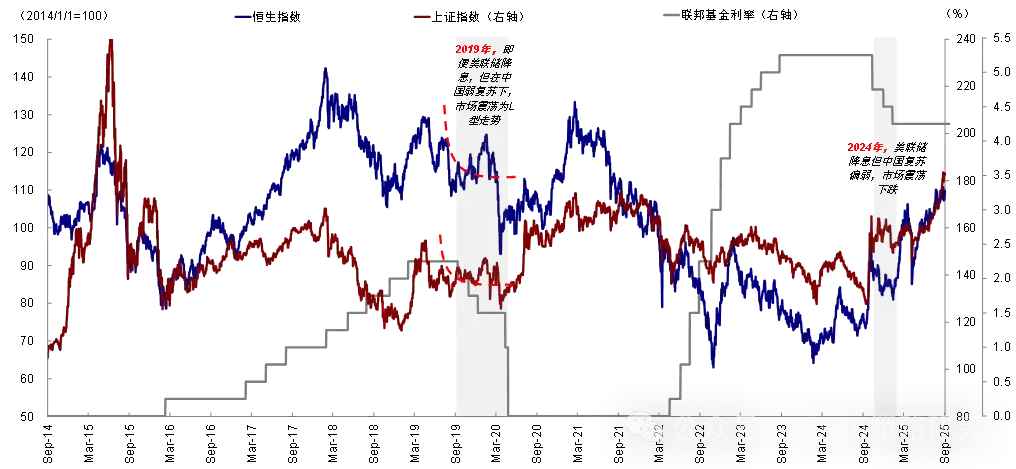
Chart: Following the Federal Reserve's interest rate cut in 2024, export sectors related to the US housing market and industries like non-ferrous metals associated with investment are expected to benefit.
Editor/KOKO