
In October 2025, the consumer price index (CPI) increased by 0.2% year-on-year.
In October 2025, the year-on-year decline in producer prices for industrial products continued to narrow, with a month-on-month shift from stability to growth.
Official sources reported: In October 2025, the CPI turned from a decline to an increase, while the PPI’s rate of decrease narrowed.
 According to the National Bureau of Statistics, in October 2025, the national consumer price index increased by 0.2% year-on-year. Specifically, prices in urban areas rose by 0.3%, while those in rural areas decreased by 0.2%; food prices fell by 2.9%, and non-food prices increased by 0.9%; consumer goods prices dropped by 0.2%, whereas service prices rose by 0.8%. On average from January to October, the national consumer price index declined by 0.1% compared with the same period last year.
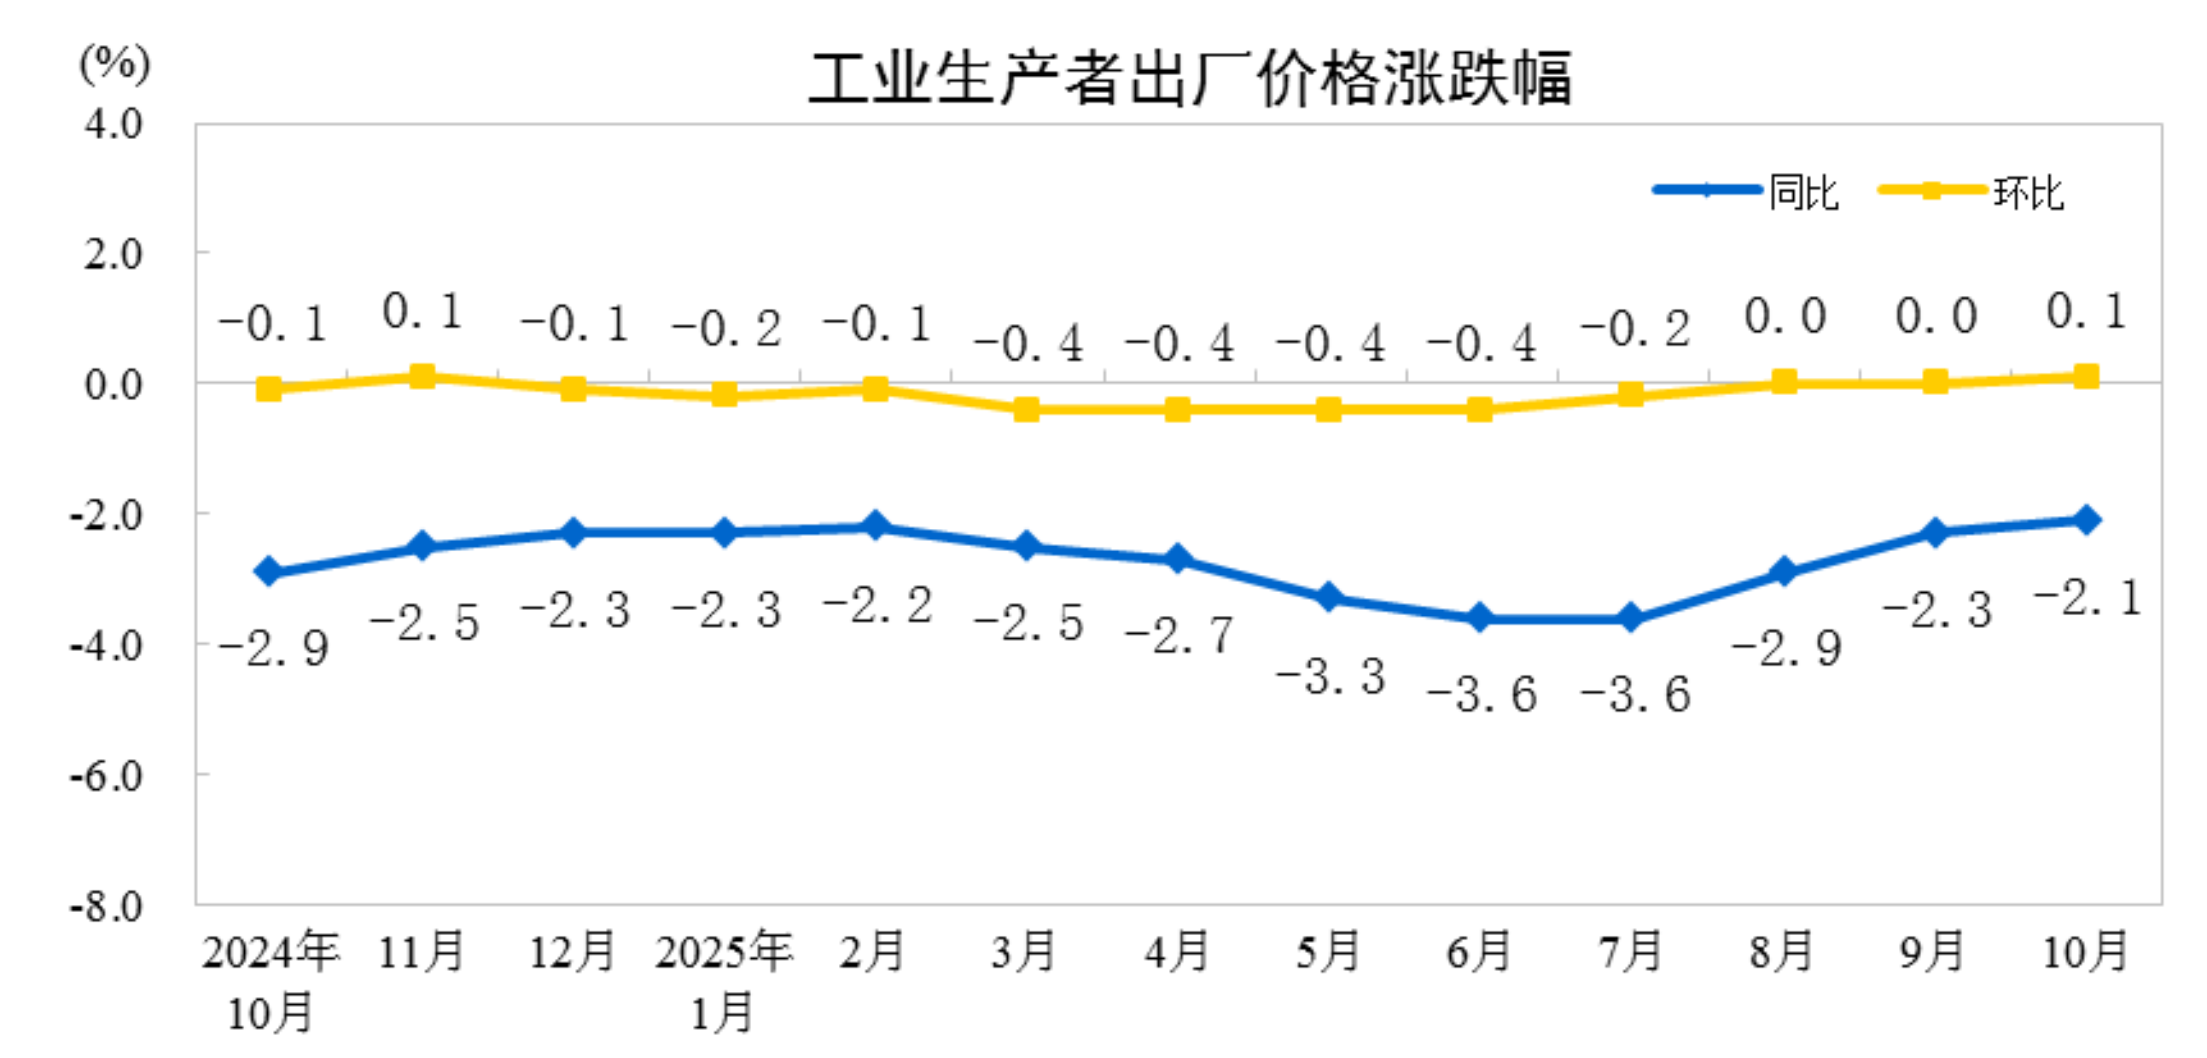
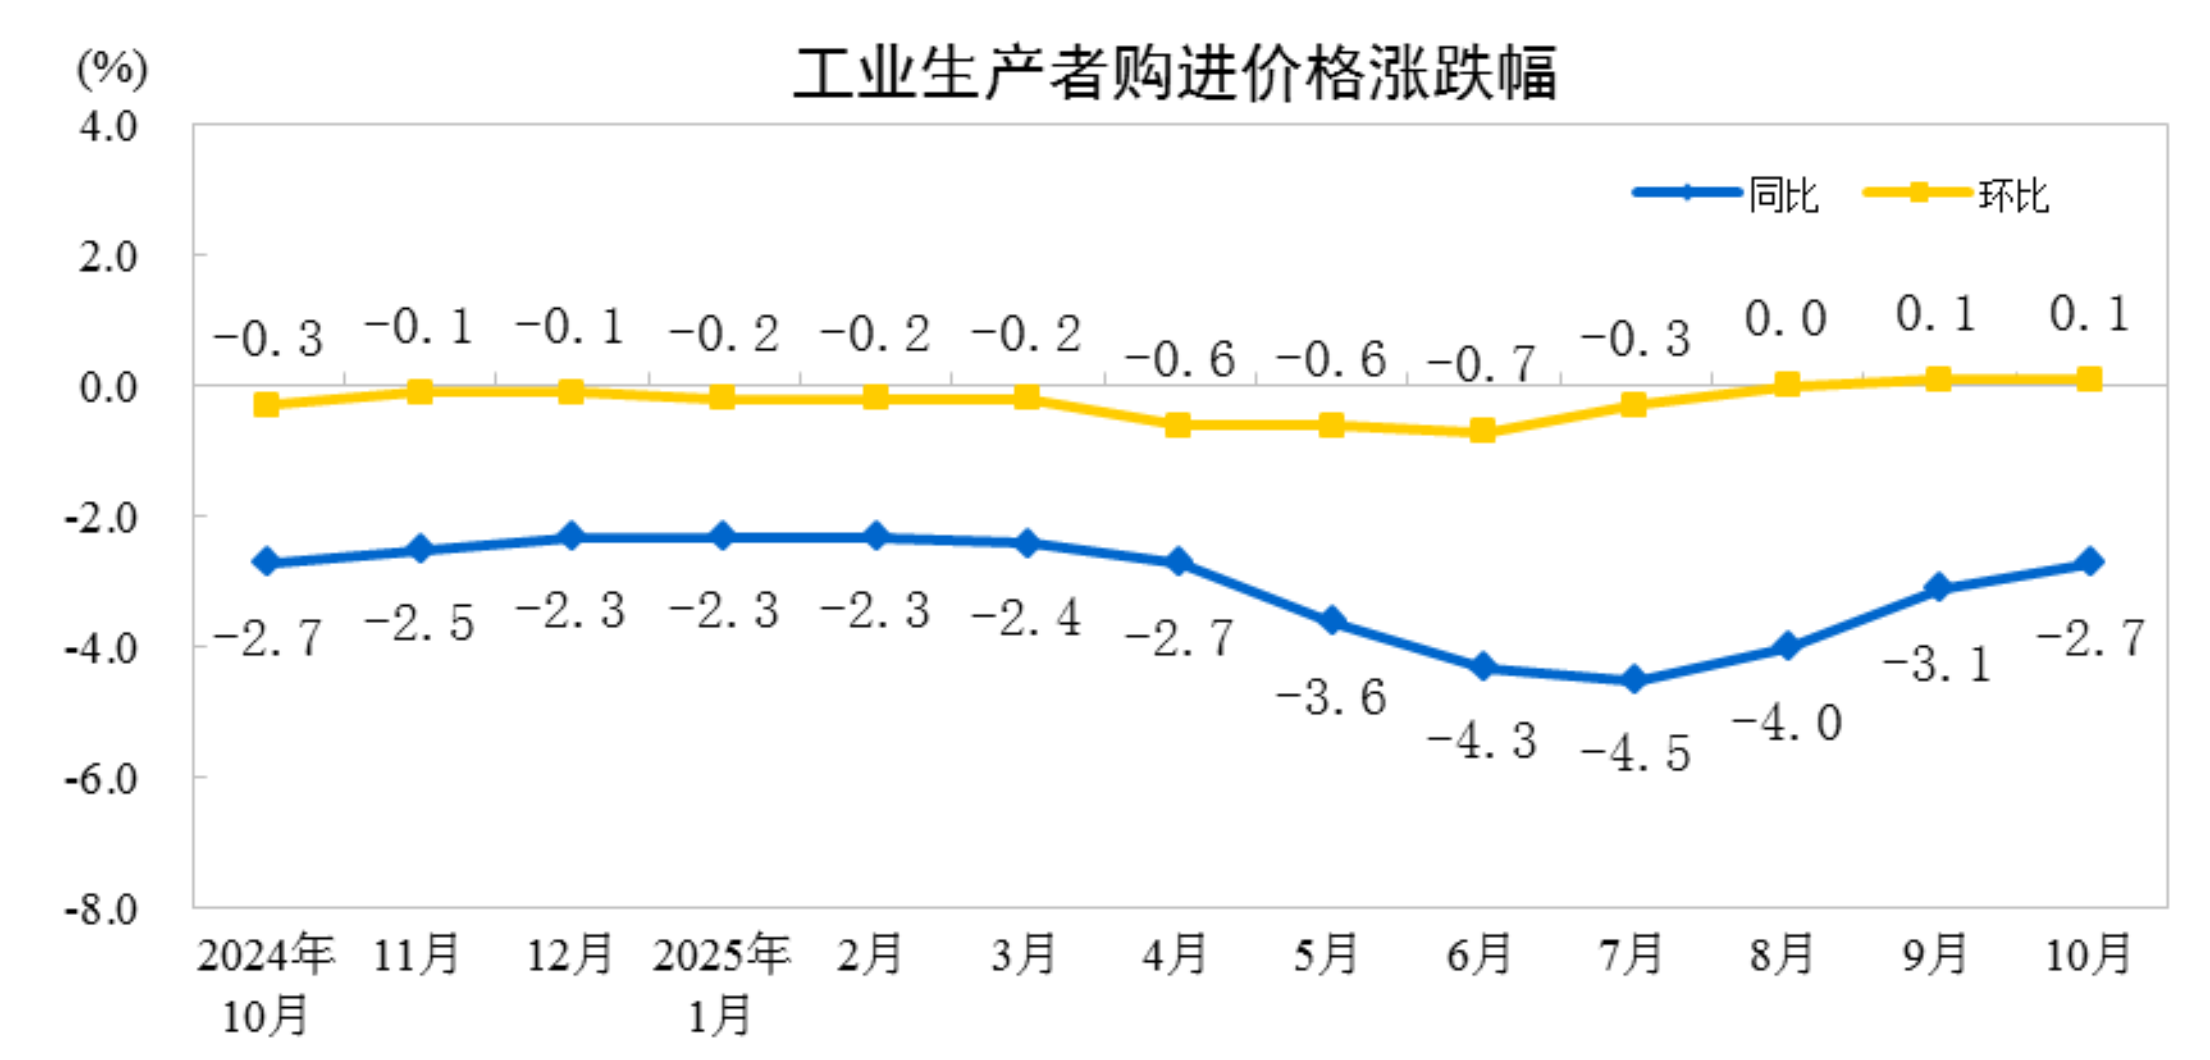
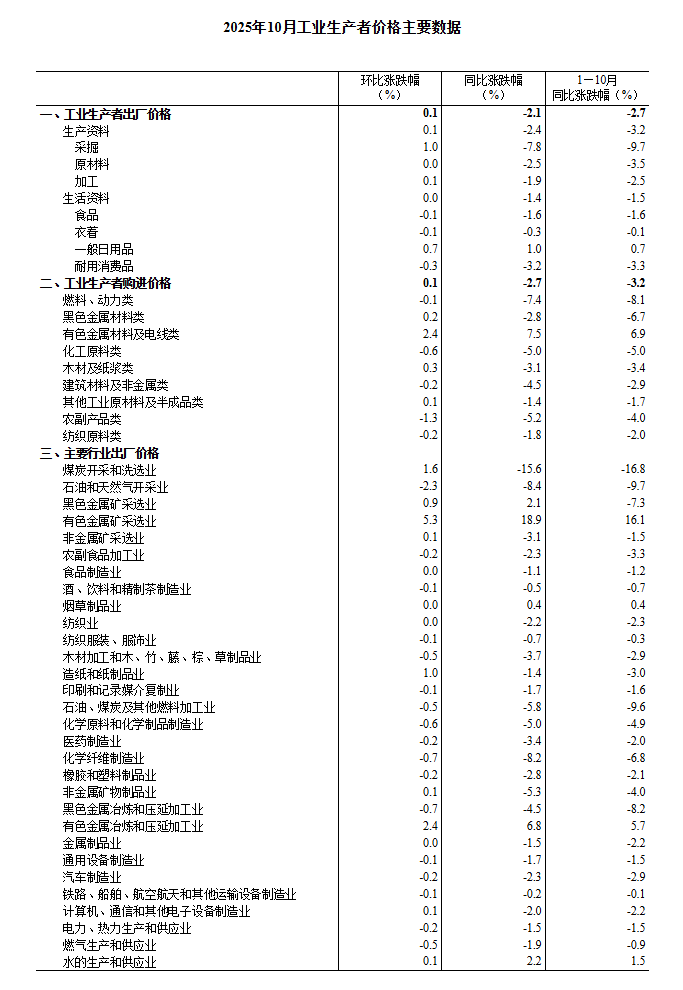
In October 2025, the Producer Price Index (PPI) for industrial producers nationwide fell by 2.1% year-on-year, with the decline narrowing by 0.2 percentage points from the previous month; month-on-month, it shifted from being flat in the previous month to an increase of 0.1%. The PPI for industrial producers' purchases fell by 2.7% year-on-year, with the decline narrowing by 0.4 percentage points from the previous month; month-on-month, it increased by 0.1%, the same as the previous month. On average from January to October, the PPI for industrial producers was 2.7% lower than the same period last year, while the PPI for industrial producers' purchases fell by 3.2%.
Dong Lijuan, Chief Statistician of the Urban Department of the National Bureau of Statistics, interpreted the CPI and PPI data for October 2025.
In October 2025, the consumer price index increased by 0.2% year-on-year.
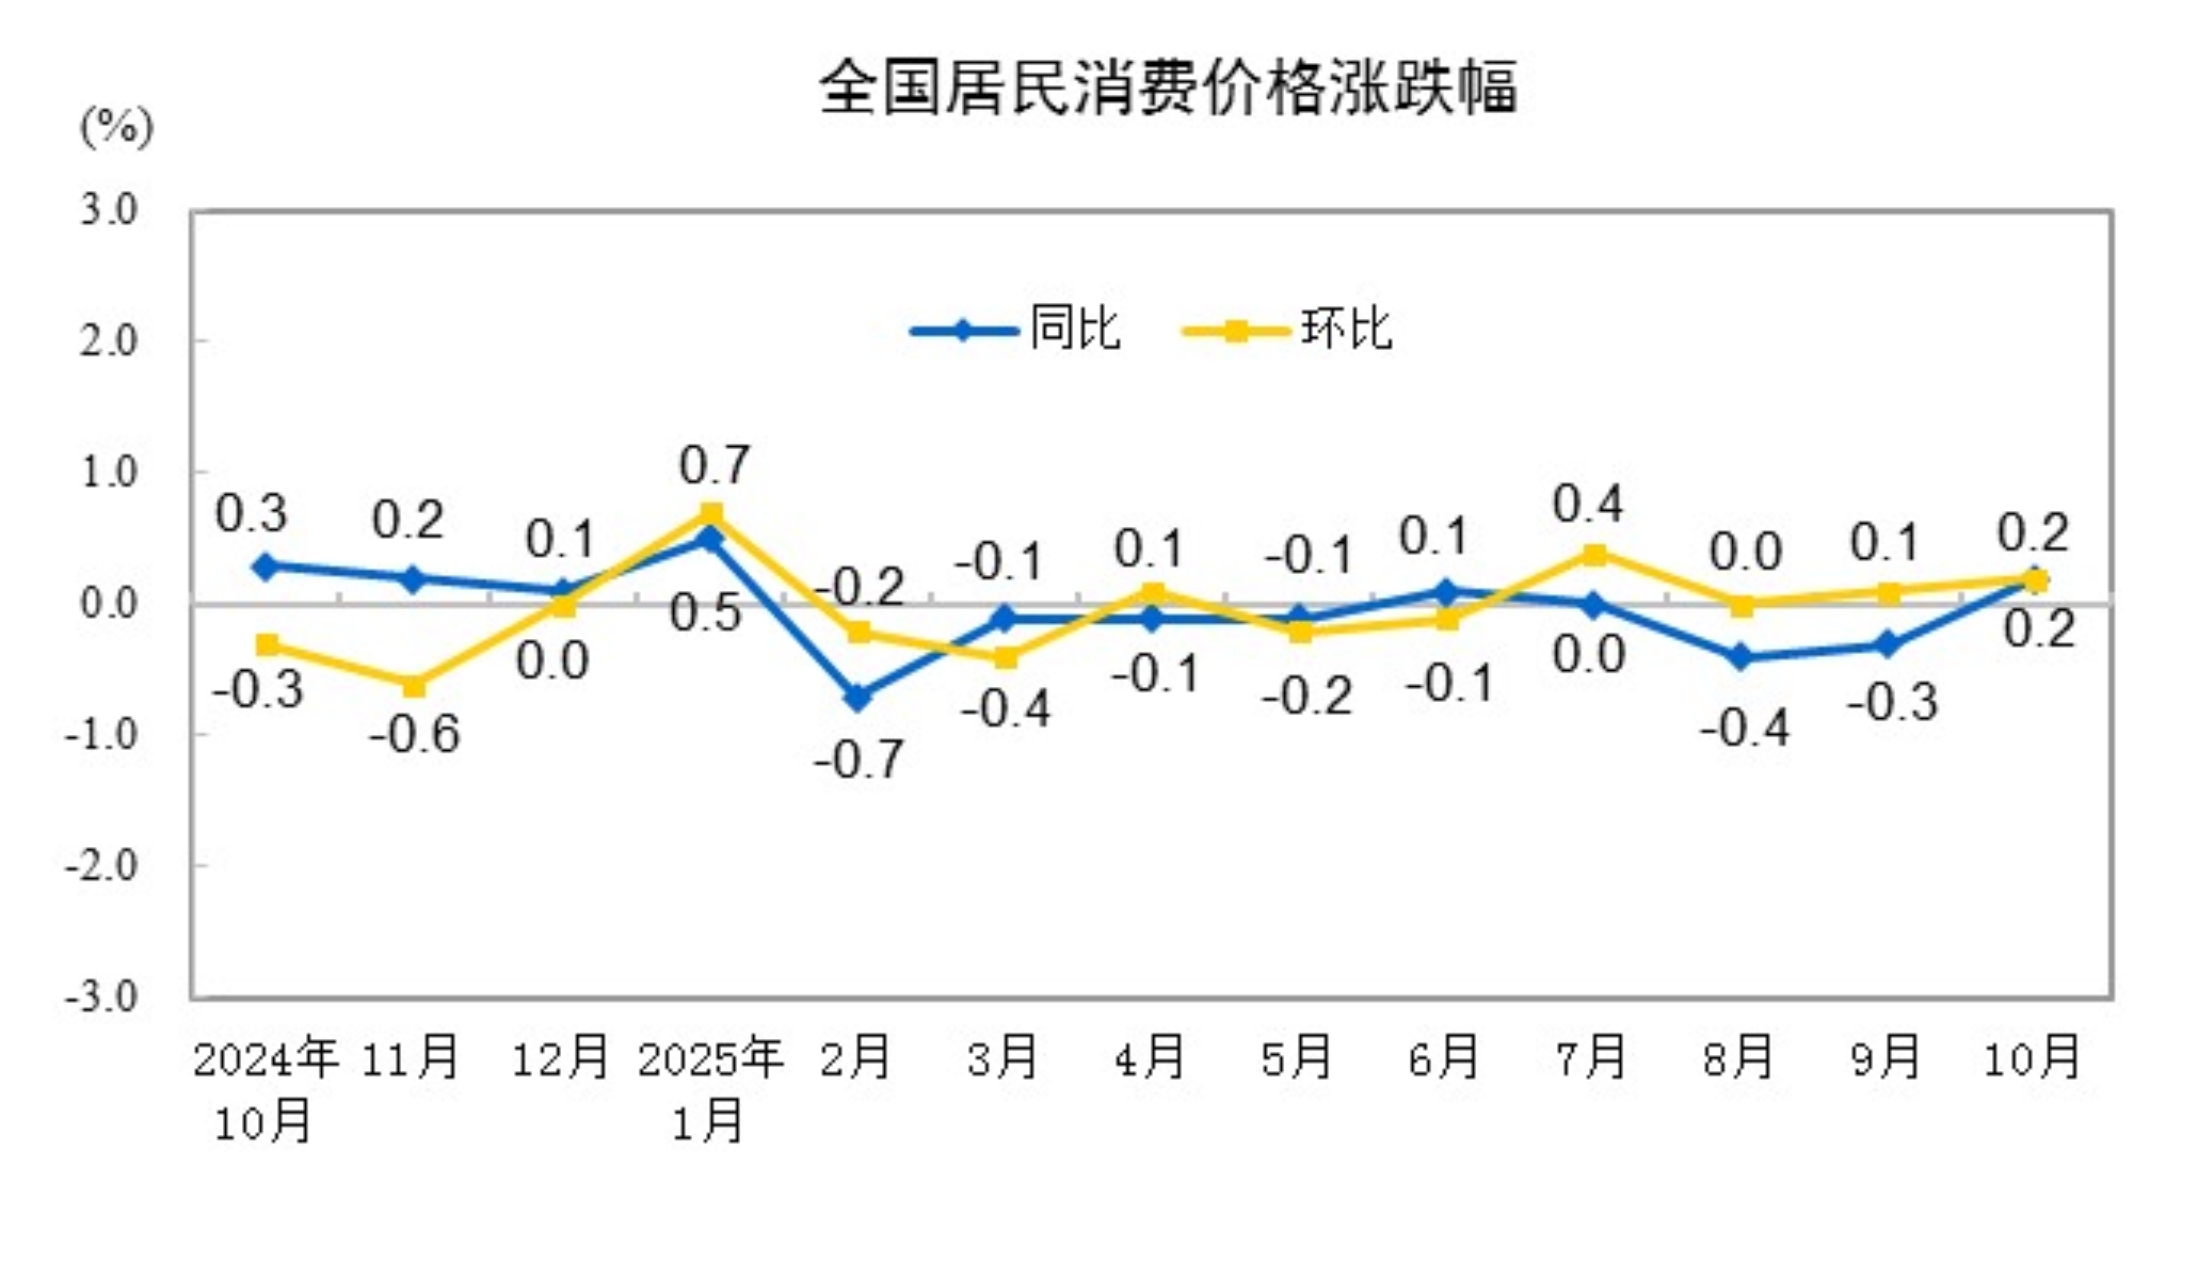
In October 2025, the national consumer price index (CPI) increased by 0.2% year-on-year. Specifically, urban areas saw a rise of 0.3%, while rural areas experienced a 0.2% decline; food prices dropped by 2.9%, while non-food prices rose by 0.9%; consumer goods prices fell by 0.2%, and service prices increased by 0.8%. From January to October, on average, the national consumer price was 0.1% lower than the same period last year.
In October, the national consumer price index (CPI) increased by 0.2% month-on-month. Specifically, urban areas saw a rise of 0.2%, while rural areas experienced a 0.1% increase; food prices rose by 0.3%, and non-food prices increased by 0.2%; consumer goods prices rose by 0.2%, and service prices increased by 0.2%.
I. Year-on-Year Changes in Prices of Various Goods and Services
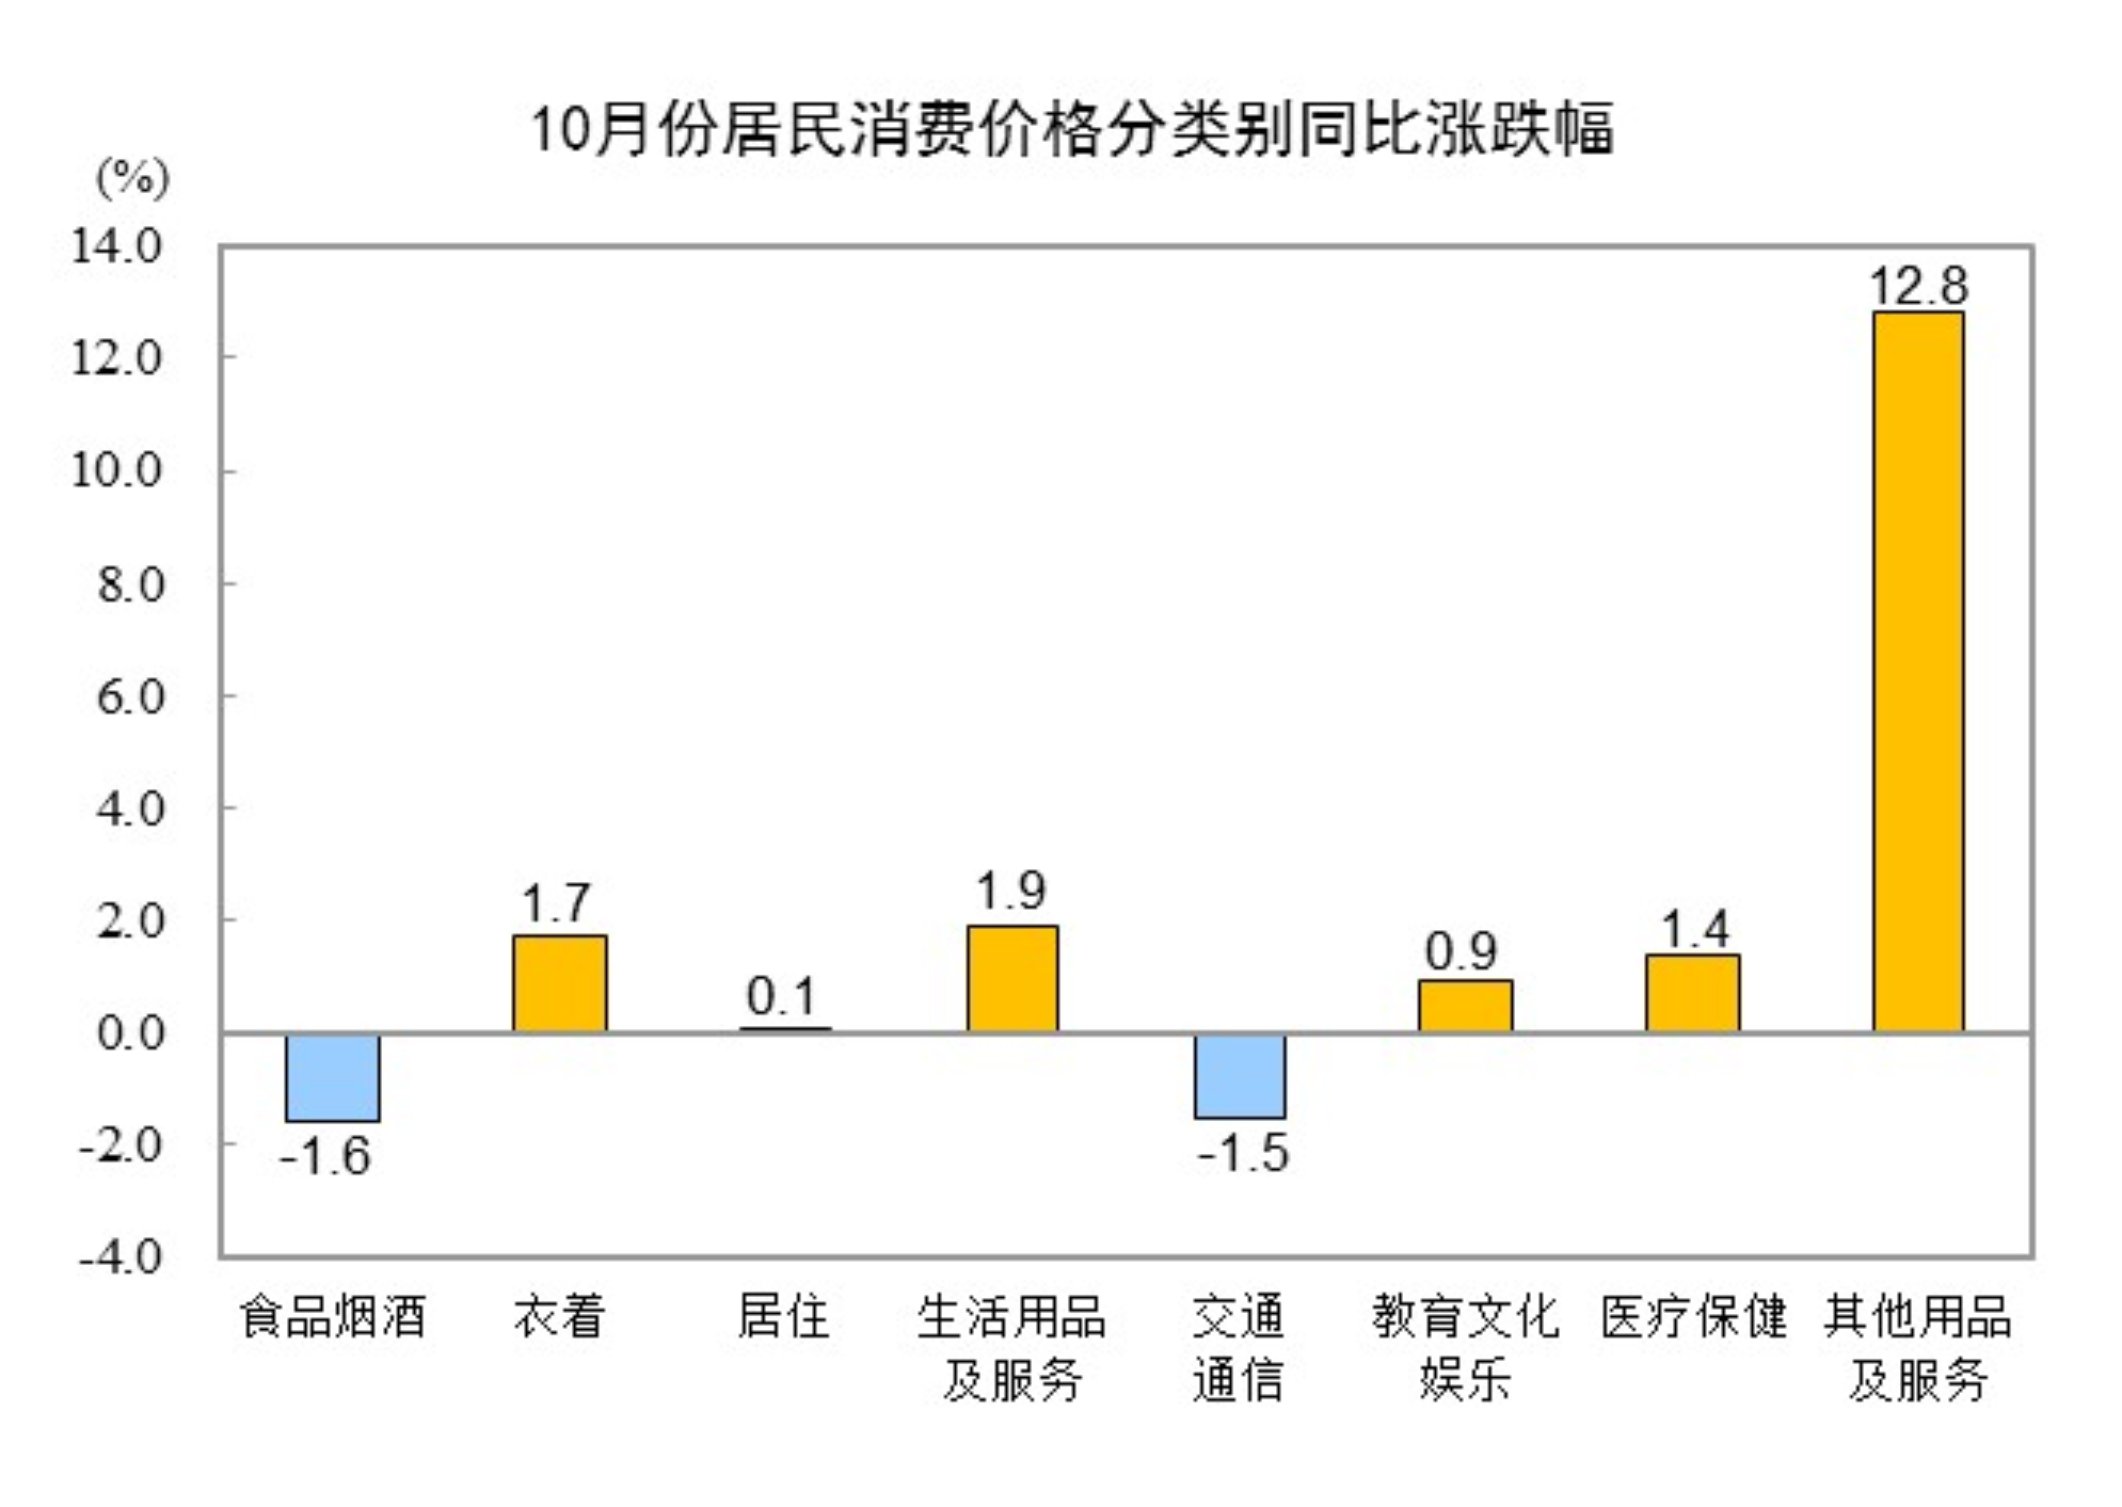
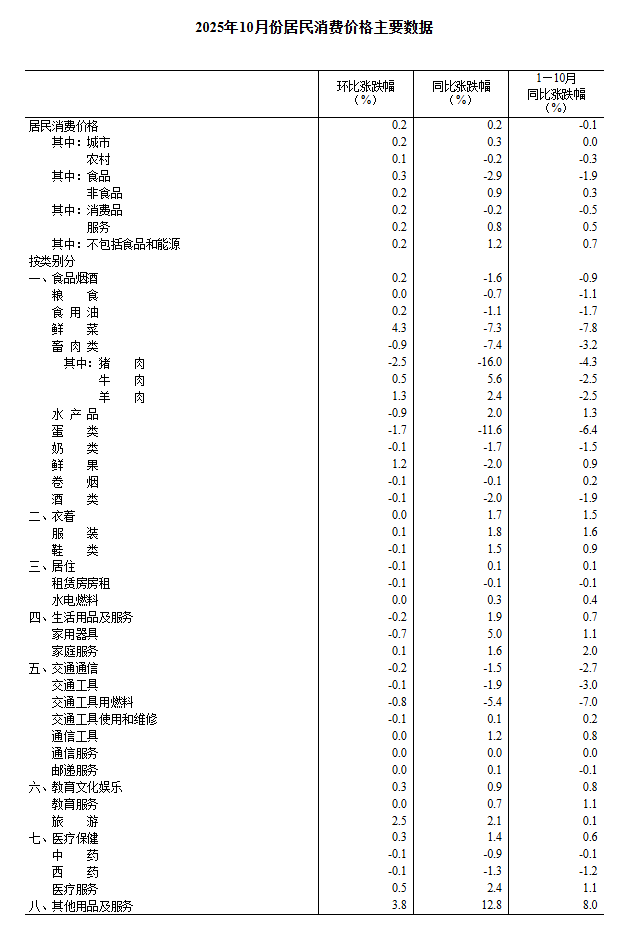
In October, the prices of tobacco and alcohol products declined by 1.6% year-on-year, contributing to a 0.46-percentage-point decline in the CPI. Among food items, egg prices fell by 11.6%, leading to a 0.08-percentage-point drop in the CPI; meat prices decreased by 7.4%, contributing to a 0.23-percentage-point drop in the CPI, with pork prices declining by 16.0%, also contributing to a 0.23-percentage-point drop in the CPI; fresh vegetable prices dropped by 7.3%, resulting in a 0.18-percentage-point fall in the CPI; fresh fruit prices declined by 2.0%, contributing to a 0.04-percentage-point drop in the CPI; grain prices fell by 0.7%, leading to a 0.01-percentage-point decline in the CPI; aquatic product prices increased by 2.0%, contributing to a 0.04-percentage-point rise in the CPI.
Among the other seven major categories of prices, six increased and one decreased year-on-year. Specifically, prices for miscellaneous goods and services, household goods and services, and clothing increased by 12.8%, 1.9%, and 1.7%, respectively; healthcare, education, culture and entertainment, and housing prices rose by 1.4%, 0.9%, and 0.1%, respectively; transportation and communication prices decreased by 1.5%.
II. Month-on-Month Changes in Prices of Various Goods and Services
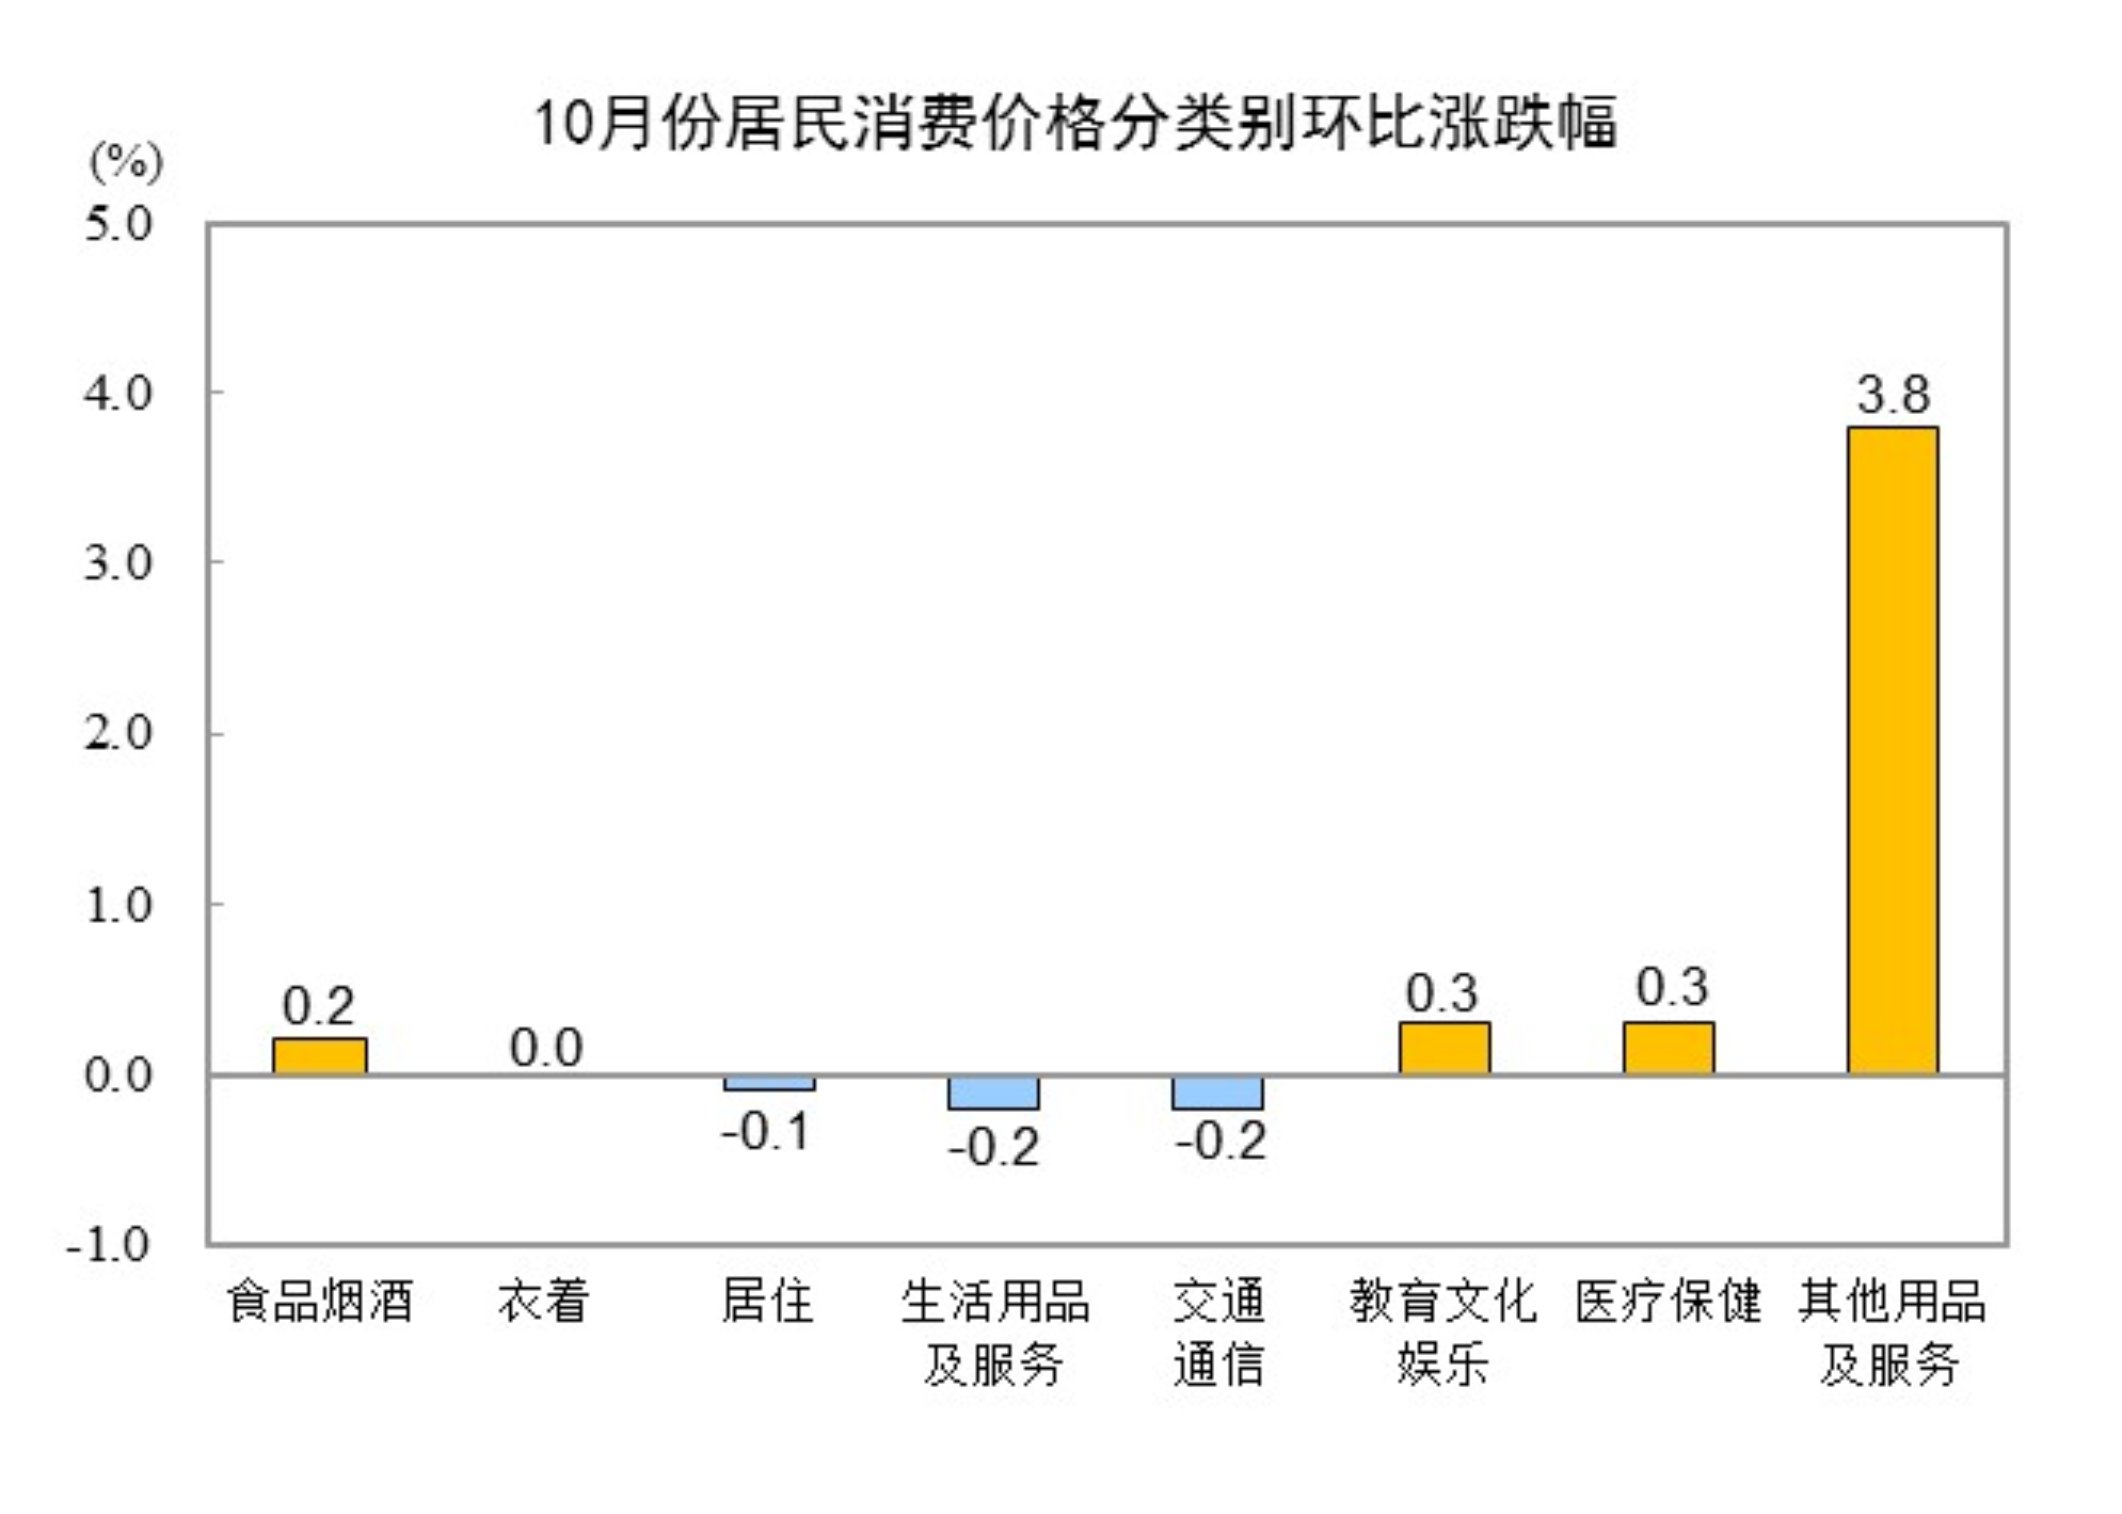
In October, the prices of food, alcohol, and tobacco increased by 0.2% month-on-month, contributing to a rise of approximately 0.07 percentage points in the CPI. Among food items, fresh vegetable prices rose by 4.3%, contributing to a rise of about 0.09 percentage points in the CPI; fresh fruit prices increased by 1.2%, contributing to a rise of about 0.03 percentage points in the CPI; egg prices fell by 1.7%, leading to a decline of about 0.01 percentage points in the CPI; livestock meat prices dropped by 0.9%, resulting in a decline of about 0.03 percentage points in the CPI, including pork prices falling by 2.5%, which contributed to a decrease of about 0.03 percentage points in the CPI; aquatic product prices declined by 0.9%, causing a reduction of about 0.02 percentage points in the CPI.
Among the other seven major categories of prices, three increased, one remained stable, and three decreased on a month-on-month basis. Specifically, prices for other goods and services, education, culture and entertainment, and healthcare increased by 3.8%, 0.3%, and 0.3%, respectively; apparel prices remained unchanged; prices for household goods and services, transportation and communication, and housing decreased by 0.2%, 0.2%, and 0.1%, respectively.
The year-on-year decline in producer prices for industrial products continued to narrow in October 2025, with a shift from flat to positive month-on-month growth.
In October 2025, the Producer Price Index (PPI) for industrial producers nationwide fell by 2.1% year-on-year, with the decline narrowing by 0.2 percentage points from the previous month; month-on-month, it shifted from being flat in the previous month to an increase of 0.1%. The PPI for industrial producers' purchases fell by 2.7% year-on-year, with the decline narrowing by 0.4 percentage points from the previous month; month-on-month, it increased by 0.1%, the same as the previous month. On average from January to October, the PPI for industrial producers was 2.7% lower than the same period last year, while the PPI for industrial producers' purchases fell by 3.2%.
I. Year-on-Year Changes in Industrial Producer Prices
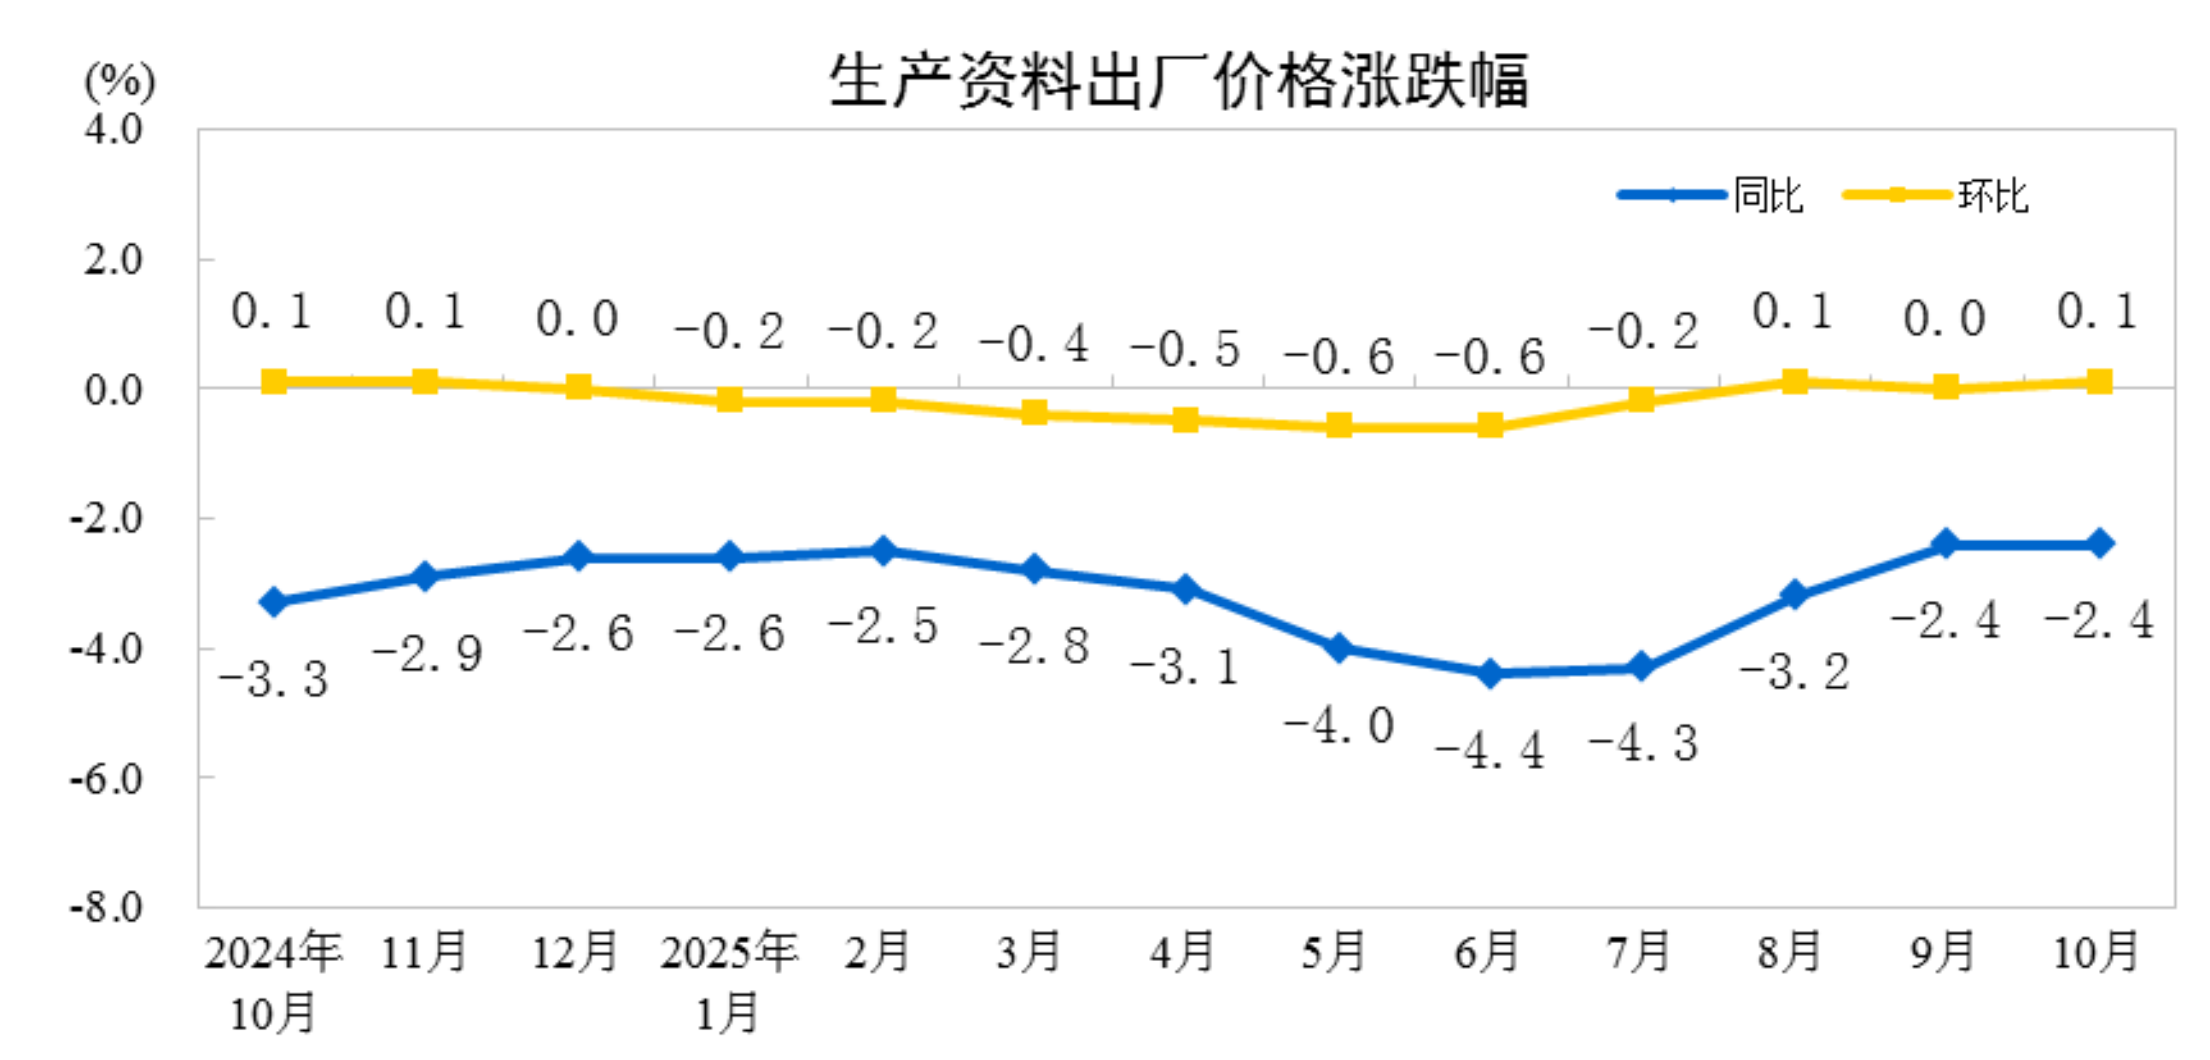
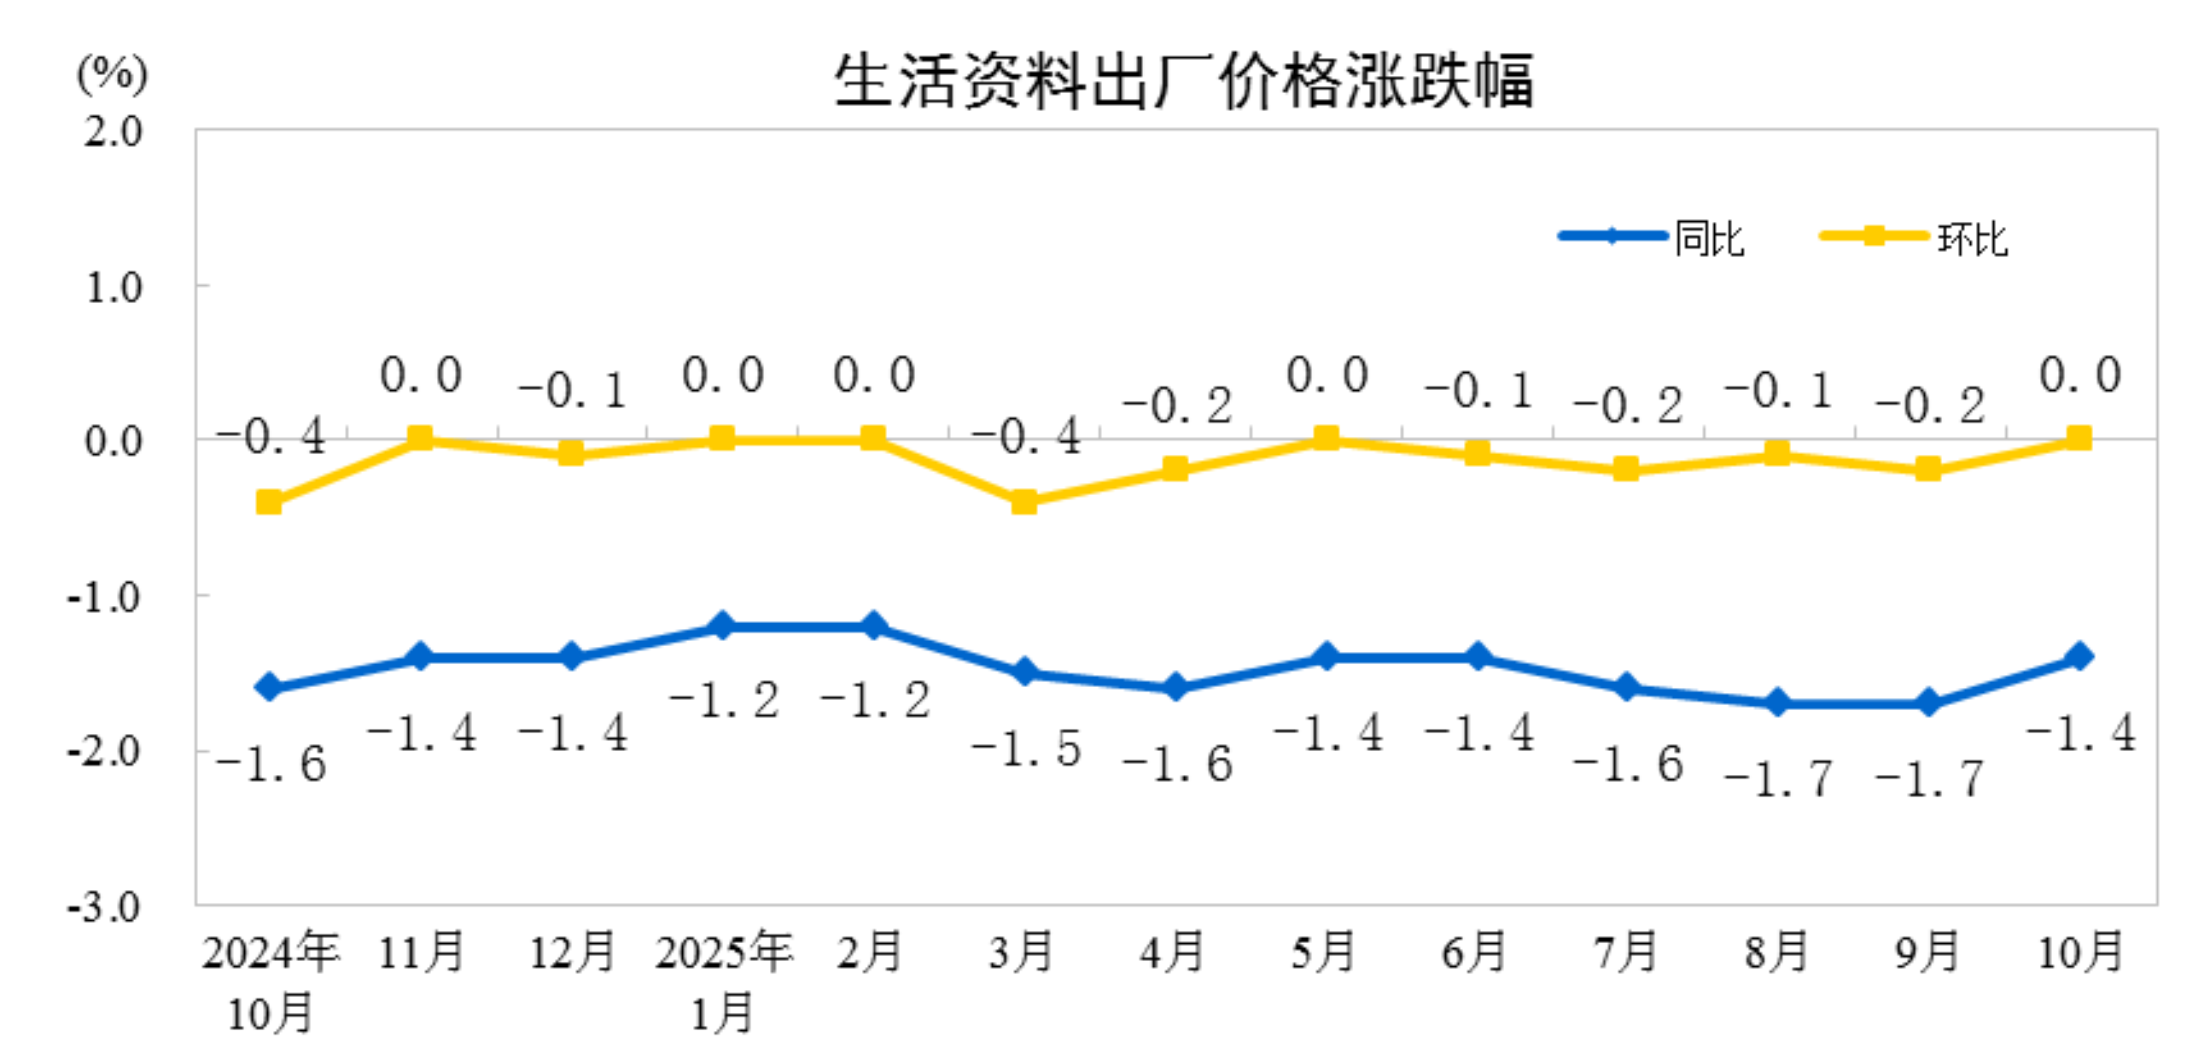
In October, the producer price index for industrial producers showed that production material prices fell by 2.4%, affecting the overall level of producer prices to drop by about 1.77 percentage points. Among them, mining industry prices fell by 7.8%, raw materials industry prices fell by 2.5%, and processing industry prices fell by 1.9%. Prices of consumer goods fell by 1.4%, impacting the overall level of producer prices to drop by about 0.36 percentage points. Among them, food prices fell by 1.6%, clothing prices fell by 0.3%, general daily necessities prices rose by 1.0%, and durable consumer goods prices fell by 3.2%.
In the PPI for industrial producers' purchases, fuel and power prices fell by 7.4%, agricultural and sideline products prices fell by 5.2%, chemical raw materials prices fell by 5.0%, building materials and non-metallic products prices fell by 4.5%, ferrous metal materials prices fell by 2.8%, textile raw materials prices fell by 1.8%; non-ferrous metal materials and wire prices rose by 7.5%.
II. Month-on-Month Changes in Industrial Producer Prices
In October, the producer price index for industrial producers showed that production material prices rose by 0.1%, contributing to a rise of about 0.08 percentage points in the overall level of producer prices. Among them, mining industry prices rose by 1.0%, raw material industry prices remained stable, and processing industry prices rose by 0.1%. Consumer goods prices were stable. Among them, food and clothing prices both fell by 0.1%, general daily necessities prices rose by 0.7%, and durable consumer goods prices fell by 0.3%.
In the prices for purchased goods by industrial producers, the prices of non-ferrous metal materials and wire products increased by 2.4%, while those of ferrous metal materials rose by 0.2%; the prices of agricultural and sideline products fell by 1.3%, chemical raw materials dropped by 0.6%, building materials and non-metal products, as well as textile raw materials, both decreased by 0.2%, and fuel and power prices fell by 0.1%.
CPI Turns Positive in October 2025, PPI Decline Narrows
Dong Lijuan, Chief Statistician of the Urban Department of the National Bureau of Statistics, Interprets CPI and PPI Data for October 2025
In October, policy measures to expand domestic demand continued to take effect, coupled with the boost from the National Day and Mid-Autumn Festival long holidays. The Consumer Price Index (CPI) increased by 0.2% month-on-month and year-on-year; the core CPI, excluding food and energy prices, rose by 1.2% year-on-year, marking the sixth consecutive month of expansion. Affected by improved supply-demand relations in some domestic industries and the transmission of international commodity prices, the Producer Price Index (PPI) for industrial producers turned from being flat last month to a 0.1% increase, the first rise within the year; it fell by 2.1% year-on-year, with the decline narrowing by 0.2 percentage points compared to the previous month, marking the third consecutive month of narrowing.
I. CPI Monthly Increase Expands, Turning Positive Year-on-Year
The CPI increased by 0.2% month-on-month, with the increase expanding by 0.1 percentage points compared to the previous month and slightly higher than the seasonal level. Service prices turned from a decline to an increase. Service prices, which fell by 0.3% the previous month, rose by 0.2%, exceeding the seasonal level by 0.2 percentage points, contributing to a roughly 0.07 percentage point increase in the CPI on a monthly basis. In services, the overlap of the National Day and Mid-Autumn Festival holidays led to strong travel demand, with hotel accommodation, airfare, and tourism prices rising by 8.6%, 4.5%, and 2.5%, respectively, all above seasonal levels; medical service prices increased by 0.5%. Food price increases were higher than seasonal levels. Food prices rose by 0.3%, whereas the seasonal level was a decrease of 0.1 percentage points. During the holiday period, increased consumer demand led to price increases ranging between 0.5% and 4.3% for fresh vegetables, lamb, fresh fruits, shrimp, crabs, and beef. Industrial consumer goods prices remained stable with slight increases. Energy prices fell by 0.4%, but excluding energy, industrial consumer goods prices rose by 0.3%, contributing to about a 0.07 percentage point increase in the CPI on a monthly basis, with domestic gold jewelry prices surging by 10.2% due to the rise in international gold prices.
The CPI turned from a 0.3% decline in the previous month to a 0.2% increase year-on-year. Among these, food and energy prices remained low but saw narrowing declines. Food prices fell by 2.9%, with the decline narrowing by 1.5 percentage points from the previous month, contributing to approximately a 0.54 percentage point decrease in the CPI year-on-year. Within food, pork, eggs, and fresh vegetable prices fell between 7.3% and 16.0%, with declines narrowing; beef, lamb, and aquatic product prices rose between 2.0% and 5.6%, with increases expanding. Energy prices fell by 2.4%, including a 5.5% drop in gasoline prices, contributing to about a 0.18 percentage point decrease in the CPI year-on-year. Excluding food and energy prices, the core CPI rose by 1.2% year-on-year, marking the sixth consecutive month of expansion and reaching its highest level since March 2024. Service prices have gradually recovered since March, increasing by 0.8% this month, with the increase expanding by 0.2 percentage points from the previous month. Airfare and hotel accommodation prices rose by 8.9% and 2.8%, respectively; medical and domestic services prices increased by 2.4% and 2.3%, respectively. Excluding energy, industrial consumer goods prices rose by 2.0%, with the increase expanding for the sixth consecutive month. Gold and platinum jewelry prices surged by 50.3% and 46.1%, respectively. Policy effects aimed at expanding domestic demand continued to manifest, with home appliances, entertainment durable consumer goods, and household sundries prices rising between 2.4% and 5.0%, and the decline in fuel-powered car prices narrowing to 2.3%.
II. PPI Turns Positive Month-on-Month, Year-on-Year Decline Continues to Narrow
The PPI turned from being flat the previous month to a 0.1% increase month-on-month, the first rise within the year. The main characteristics of the PPI’s month-on-month performance this month: First, improved supply-demand relations drove price increases in some industries. Coal mining and washing industry prices rose by 1.6% month-on-month, coal processing prices increased by 0.8%, and photovoltaic equipment and component manufacturing prices rose by 0.6%, all showing continuous increases for more than two months. Cement manufacturing, computer assembly manufacturing, lithium-ion battery manufacturing, and integrated circuit manufacturing prices all shifted from declines to increases, rising by 1.6%, 0.5%, 0.2%, and 0.2%, respectively. Second, exogenous factors influenced the divergence in price trends for domestic non-ferrous metals and oil-related industries. Rising international non-ferrous metal prices drove domestic non-ferrous metal ore mining and selection industry prices up by 5.3% month-on-month, while non-ferrous metal smelting and rolling processing industry prices increased by 2.4%, including rises of 8.7% and 4.3% in gold smelting and copper smelting prices, respectively; falling international oil prices affected domestic oil and natural gas extraction industry prices, leading to a 2.3% decline, and refined petroleum product manufacturing prices fell by 0.8%.
The PPI fell by 2.1% year-on-year, with the decline narrowing by 0.2 percentage points from the previous month, marking the third consecutive month of narrowing. First, ongoing capacity governance in key industries led to narrower year-on-year price declines in related industries. Capacity inspections and strengthened safety supervision, along with winter stockpiling and increased electricity demand, narrowed the year-on-year decline in coal mining and washing industry prices by 1.2 percentage points from the previous month. Continuous optimization of market competition order and the gradual exit of outdated capacities narrowed price declines in photovoltaic equipment and component manufacturing, battery manufacturing, and automobile manufacturing by 1.4, 1.3, and 0.7 percentage points, respectively. Second, the accelerated construction of a modern industrial system and the orderly release of consumption potential drove year-on-year price increases in related industries. Technological innovation empowered industrial transformation and upgrading, promoting intelligent, green, and integrated development in manufacturing. Non-ferrous metal smelting and rolling processing industry prices rose by 6.8% year-on-year, electronic special material manufacturing prices increased by 2.3%, microwave communication equipment prices rose by 1.8%, ship and related equipment manufacturing prices increased by 0.9%, waste resource utilization industry prices rose by 0.7%, and aircraft manufacturing prices increased by 0.5%. A series of policies to boost consumption continued to achieve results, with prices for arts and crafts and ceremonial goods manufacturing increasing by 18.4%, sports ball manufacturing prices rising by 3.3%, nutritional food manufacturing prices increasing by 2.1%, and beverage manufacturing prices rising by 0.4%.
Editor/melody