
Source: CICC Insights
Authors: Liu Gang, Zhang Dian
Recently, an interesting yet unexpected phenomenon has emerged: on the one hand, the renminbi has continued to strengthen, repeatedly hitting new highs. Since early October, the offshore renminbi exchange rate against the US dollar has appreciated by 1.3%, bringing it just a step away from the psychological level of 7. On the other hand, the stock market has been continuously correcting, especially in the Hong Kong stock market, which is typically more sensitive to exchange rates and capital flows, where declines have been even sharper, with Hang Seng Tech falling 15% from its early October peak.
Historically, exchange rate movements have exhibited a strong positive correlation with both the A-share and H-share markets, as a strengthening currency often implies foreign capital inflows and improving fundamentals in China. Not to mention, Hong Kong-listed stocks benefit additionally from the translation of stronger Renminbi earnings into Hong Kong dollar-denominated EPS.
 Chart: Recently, the stable negative correlation between Hong Kong stocks and the renminbi-to-dollar exchange rate has been broken
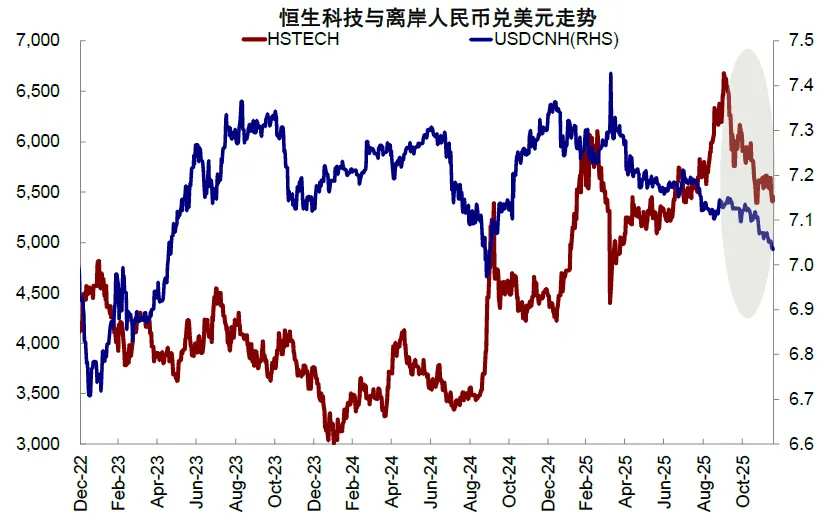
However, this pattern has recently been 'broken,' as the exchange rate strengthened while the stock market fell instead. How should we interpret this divergence—was it the exchange rate that was wrong, or was it the stock market? It is worth noting that China's trade surplus for the first 11 months reached a record high of $1.08 trillion, and with the upcoming nomination of a new Federal Reserve chair, the market’s expectations for renminbi appreciation driven by a weak US dollar and large-scale trade surplus conversion have become increasingly strong. If this conclusion holds true and the traditional logic between exchange rates and the stock market remains valid, it would imply that the revaluation of Chinese assets will enter a new phase with renewed momentum.
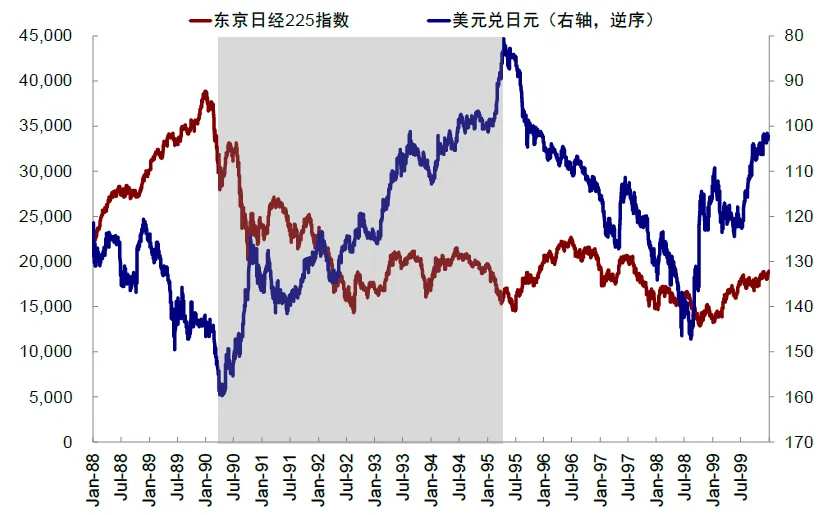
Upon closer reflection, however, this chain of logic still warrants scrutiny, much like the recent divergence. A simple explanation is that the drivers behind these two phenomena are entirely different, so their divergence does not contradict each other. Japan also experienced a prolonged period of exchange rate appreciation without stock market growth—a divergence that lasted five years (1990-1995).
Chart: From 1990 to 1995, Japan also experienced a sustained period of exchange rate appreciation but no stock market growth—a 'divergence'
The historical relationship between exchange rates and the market: a predominantly positive correlation; a strong currency coupled with a weak stock market has only occurred twice, with convergence direction depending on fundamentals.
An analysis of the historical relationship between the RMB exchange rate and the Chinese market shows that most of the time they move in tandem. The divergence, especially the recent combination of a strengthening RMB and weakening stock market, is particularly rare. The fundamental reason lies in the fact that growth and capital inflows are significant pricing factors for both the exchange rate and the stock market, resulting in a strong correlation between the two.
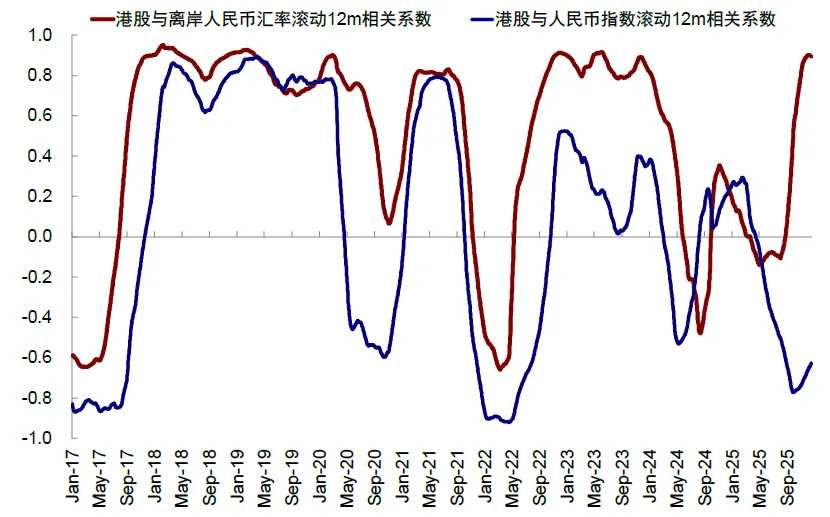
In analyzing the relationship between exchange rates and the market, we focus on the RMB-USD exchange rate rather than the RMB's exchange rate against a basket of currencies. This is mainly because the statistical relationship between the stock market and the RMB-USD exchange rate is stable, whereas it is unstable with the RMB Index. The deeper reason is that the US dollar holds a prominent position in global trade and capital flows, making the RMB-USD exchange rate possess attributes of both a 'trade exchange rate' and a 'financial exchange rate.' In contrast, the RMB Index is weighted based on China's bilateral trade volumes with various economies, giving it stronger 'trade exchange rate' characteristics. Therefore, the relationship between the RMB-USD exchange rate and the stock market is more pronounced and stable, especially for Hong Kong stocks.
Chart: A significant negative correlation between Hong Kong stocks and offshore RMB, with no significant correlation to the RMB Index.
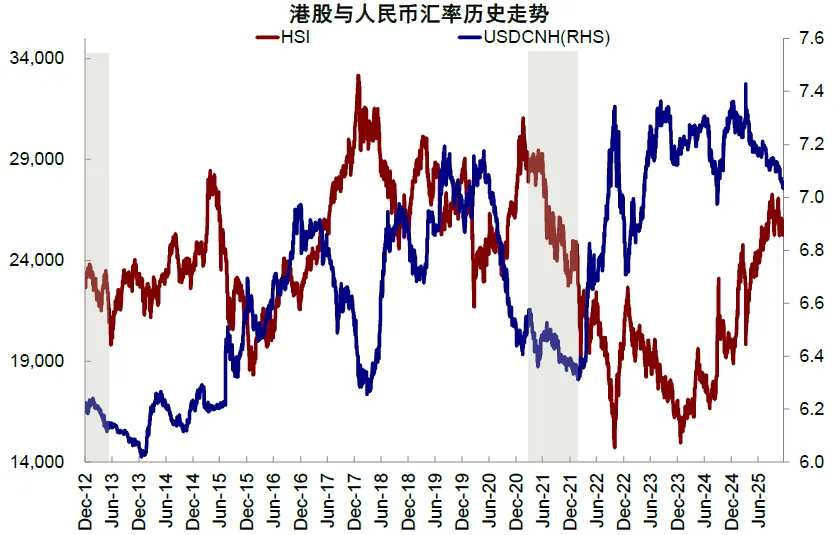
Historically, the divergence between a strengthening RMB and a weaker stock market has only occurred twice: from March to June 2013, and from July 2021 to October 2022. In terms of final outcomes, the former saw the stock market converge towards the exchange rate, while the latter saw the exchange rate converge towards the stock market. Although the directions of convergence appear different, both were related to whether policy measures were implemented. The former had policy support, while the latter lacked fundamental backing.
Chart: In the first half of 2013 and the second half of 2021, Hong Kong stocks and the RMB showed significant divergence.
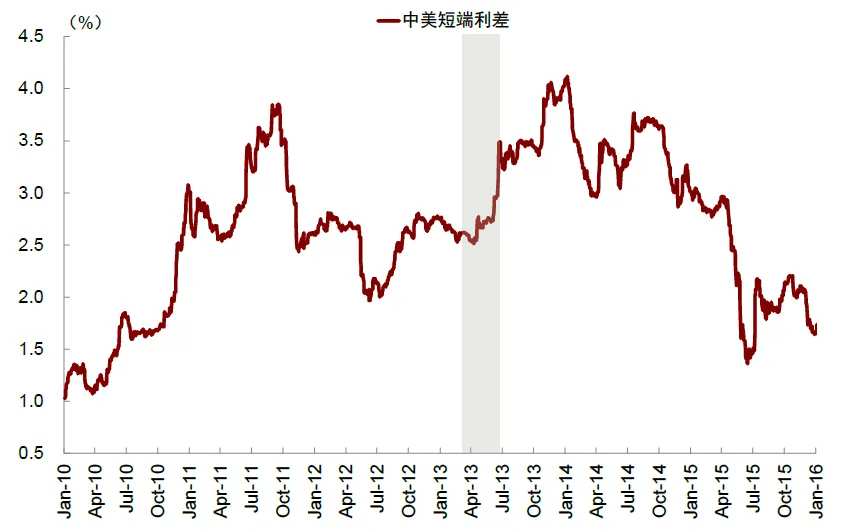
► From March to June 2013, the widening interest rate differential between the RMB and the US dollar led to a strong RMB but a weak stock market. Subsequently, thanks to countercyclical policy measures, the stock market converged towards the exchange rate. After the first quarter of 2013, China's economy faced increasingly prominent issues of growth slowdown and structural 'uneven cold and heat': on one hand, indicators representing production and consumption, such as PPI, PMI, and retail sales, were marginally declining; on the other hand, there was overheating risk in the real estate sector and local financing platforms. Policymakers had a weak willingness to cut interest rates and instead hoped to achieve 'structural adjustment and stable growth' by combining tightened financial conditions with structural policies. During this period, the stock market weakened due to downward pressure on fundamentals and tightening financial conditions; the RMB exchange rate, however, benefited from relatively tight liquidity or even a 'cash crunch,' which significantly widened the interest rate differential between China and foreign countries, leading to a temporary divergence between stocks and the exchange rate. In the second half of the year, structural pro-growth policies in areas such as infrastructure, shantytown renovation, and the information technology industry gained momentum, coupled with improved external demand, stabilizing and rebounding the stock market while the exchange rate continued to appreciate. The divergence ended with the stock market converging towards the exchange rate, primarily driven not by the previous divergence but by countercyclical policy measures.
Chart: In Q2 2013, China's financial conditions tightened, and the interest rate differential between China and the US widened
► From July 2021 to February 2022, robust exports brought substantial FX conversion demand, while domestic demand slowed, causing a divergence between the stock market and the exchange rate, similar to the current situation. Eventually, exports cooled, the economy slowed significantly, and the exchange rate converged towards the weak stock market. Entering the second half of 2021, China’s economic momentum marginally slowed, particularly with domestic demand declining sharply due to tightened policies in sectors like real estate, internet, and education. However, at that time, exports remained at a high growth rate of around 30%. Back then, in mainstream broad-based indices of A-shares and H-shares, non-tradeable sectors such as internet and consumer goods accounted for a larger proportion, thus the stock market performed poorly, with the CSI 300 and Hang Seng Index falling by 12% and 21%, respectively, during this period. Meanwhile, strong exports generated substantial FX conversion demand, driving the RMB to appreciate by 2.4%. Thereafter, the Federal Reserve began raising interest rates, China’s exports cooled, and downward economic pressures further intensified, leading the exchange rate to converge towards the weak stock market.
Chart: After 2021, a significant divergence appeared between China's commercial housing sales and export trends
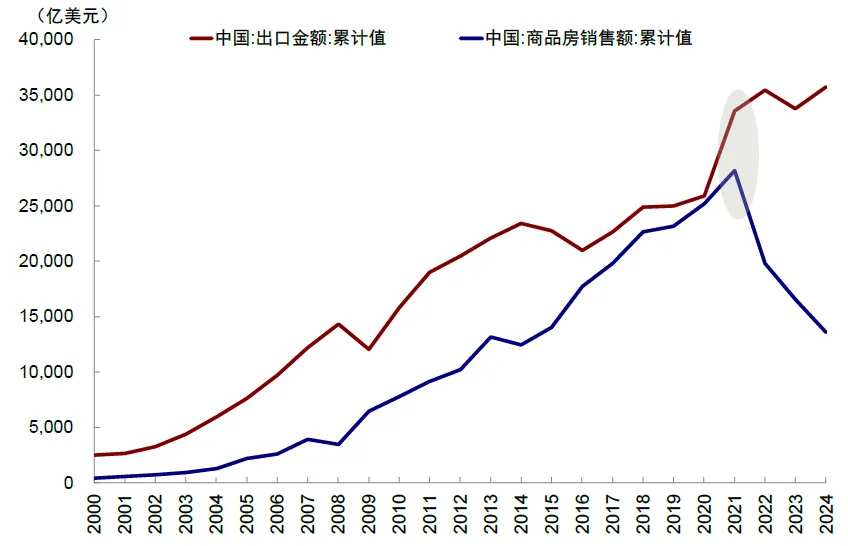
Chart: Strong export growth in 2021 brought substantial FX conversion demand
In summary, the divergence of a strong exchange rate and a weak stock market has been relatively rare historically, and the core contradiction does not lie in the disagreement over growth between stocks and the exchange rate but rather in the asymmetric impact of factors such as interest rates and exports on the stock market and the exchange rate. Over a longer horizon, it is difficult for factors such as interest rates and exports to deviate from the trajectory of growth, and the divergence between stocks and the exchange rate will also converge as these drivers return to aligned changes.
What are the reasons for the recent strong exchange rate and weak stock market? The exchange rate reflects the resonance of a weakening US dollar and record trade surpluses, while the stock market reflects the weakening fundamentals.
First, let's examine the exchange rate. It is important to clarify that since October, the RMB has mainly strengthened against the US dollar, appreciating by more than 1.3%, while the trade-weighted exchange rate against a basket of currencies has only moderately appreciated by 0.6%. So, what caused the strengthening of the RMB against the US dollar?
► Is it due to foreign capital inflows? Most likely not. On one hand, the stock market has been weak, with the CSI 300 and Hang Seng Index falling by 1.6% and 4.3%, respectively. On the other hand, according to EPFR statistics, overall foreign capital inflows have been volatile recently, with active foreign capital continuing to flow out, showing little correlation with the smooth upward trend of the RMB. Could foreign capital have flowed into the bond market? Since October, interest rates have risen, and the outstanding balance of Bond Connect has decreased by more than 50 billion yuan, making it unlikely to be a major reason. Additionally, the Bank of Japan’s interest rate hike could marginally disrupt overseas liquidity. Therefore, foreign capital inflows can essentially be ruled out as the dominant factor.
Chart: Recent foreign capital inflows have shown weak correlation with the smooth strengthening of the RMB
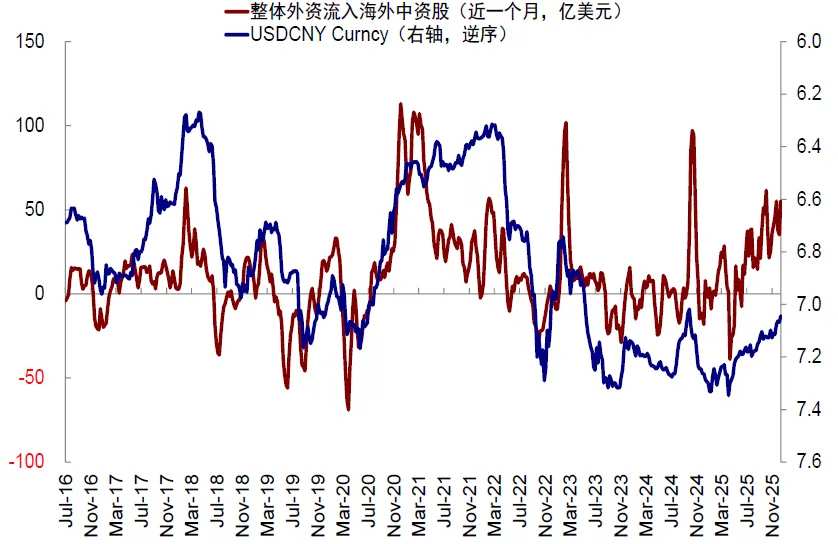
Chart: This year, foreign capital inflows into Hong Kong stocks have shown a 'bipolar differentiation,' with the underweight allocation of funds from Asia Pacific ex-Japan significantly narrowing.
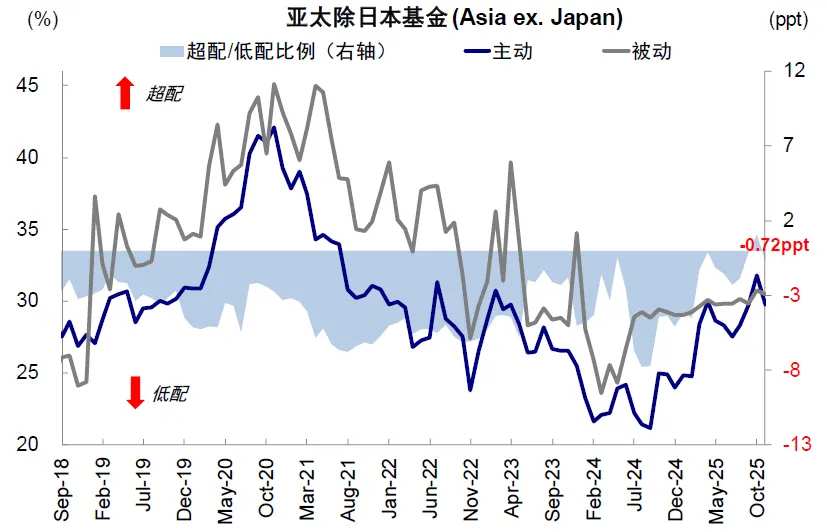
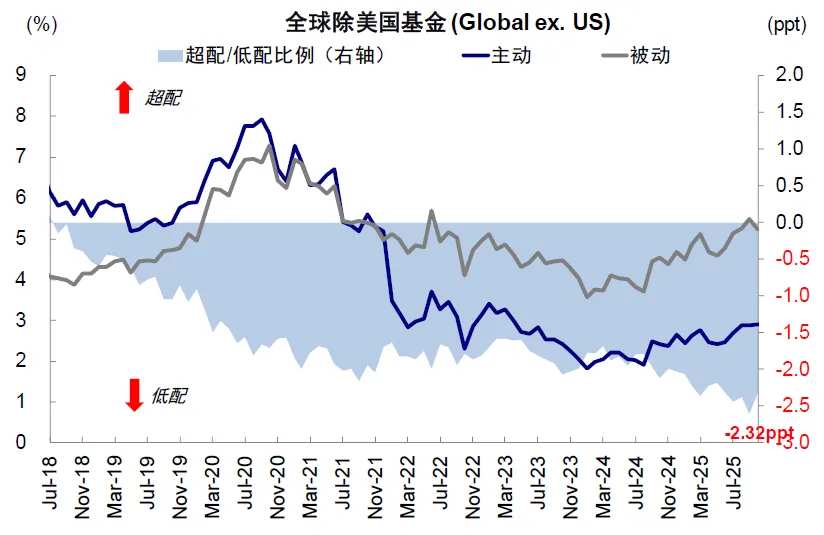
Chart: However, for foreign capital primarily targeting global markets excluding the United States, its underweight position in Chinese assets has even widened.
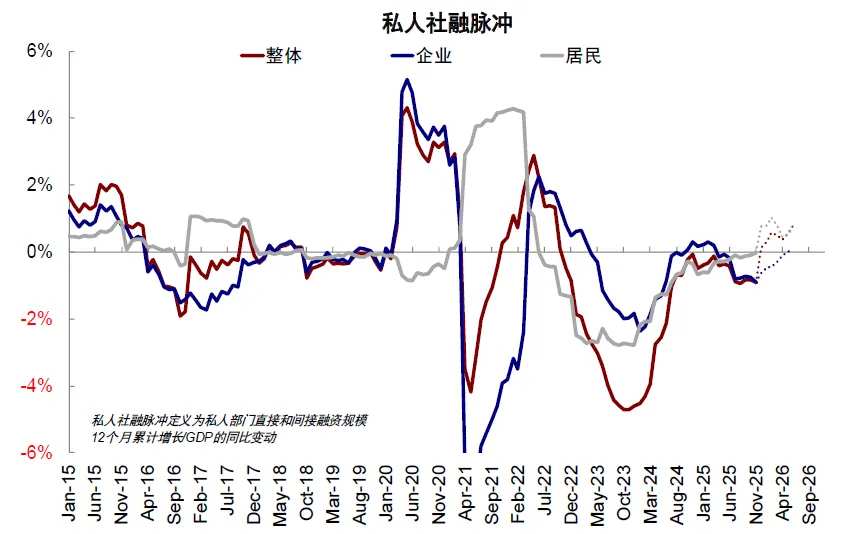
► Is it an improvement in fundamentals? It doesn't seem so. In the near term, domestic demand has continued to weaken, with the PMI still below the 50-mark threshold. Fixed asset investment has been negative for three consecutive months, and retail sales growth has gradually declined from 4.6% in August to 4.0% in November. The sluggish economy reflects weak credit demand: since September, the broad social financing impulse has turned negative, fiscal impulse has receded, and private sector endogenous credit demand has remained persistently low. Additionally, the Central Economic Work Conference for 2025 signaled relatively moderate aggregate stimulus measures, making it difficult to reverse the current weak credit situation in the short term. Without a turnaround in leading indicators, the market may struggle to form RMB appreciation expectations driven by fundamental improvements.
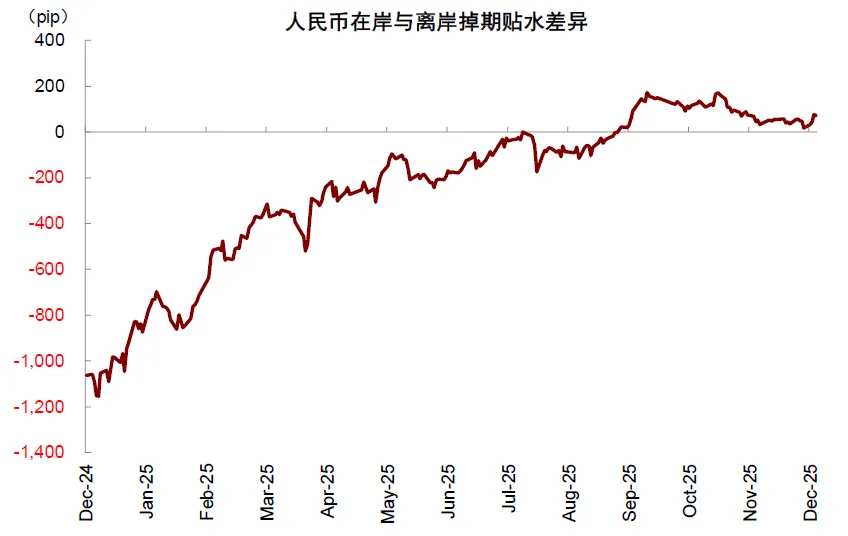
► Is it policy-driven? No. Operationally, the central bank's intervention in the foreign exchange market appears to be weakening: during the first half of the year when depreciation pressure was high, the discount of onshore versus offshore RMB swaps was significantly larger (i.e., the difference was negative), implying that foreign investors hedging their China investments through onshore currency had higher returns than offshore. Since September, the discount on onshore swaps has become smaller than offshore, potentially indicating reduced intervention by policymakers. Moreover, logically speaking, in an environment where domestic demand remains subdued, significant appreciation could harm China’s export competitiveness and hinder the economy from exiting a low-inflation environment. Furthermore, according to recent statements by the central bank, as the RMB continues to strengthen, the Q3 monetary policy implementation report removed the word “resolutely” from the phrase “preventing excessive exchange rate fluctuations,” softening the tone. Additionally, the goal of “enhancing resilience in the foreign exchange market,” mentioned in the Q2 report, was replaced with “maintaining exchange rate flexibility.”
Chart: The difference between the onshore and offshore RMB swap discounts turning from negative to positive may indicate a reduction in intervention in the onshore exchange rate.
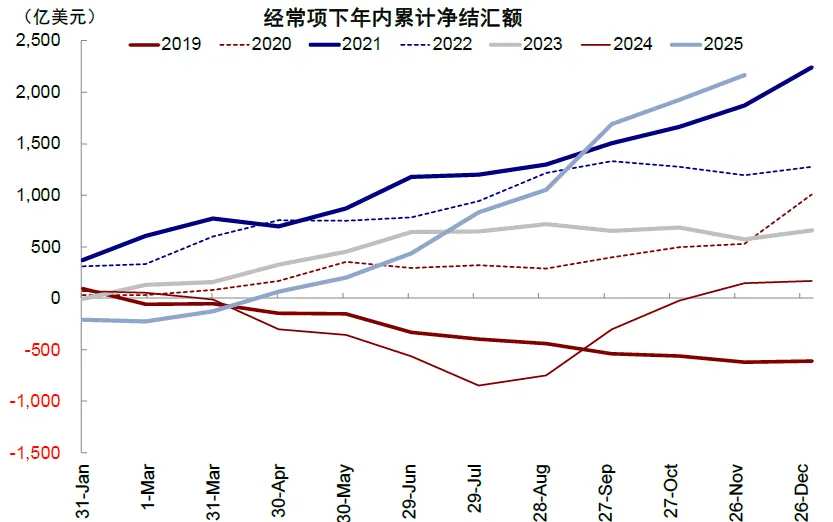
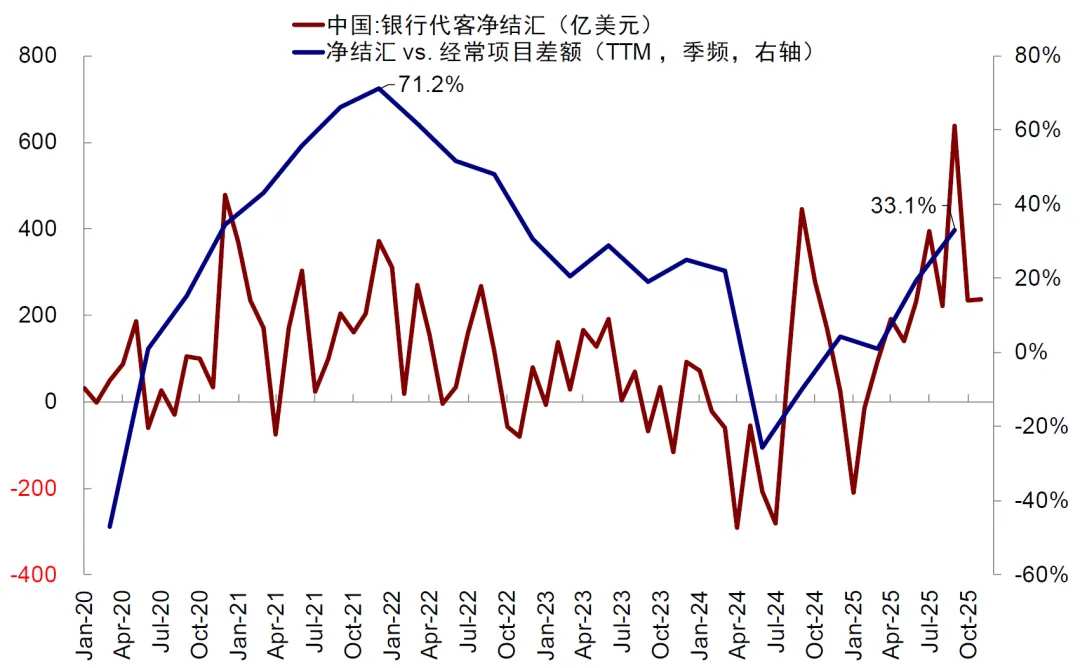
► After ruling out the above factors, the recent trend may mainly be due to the weakening of the US dollar and industrial capital conversions stemming from resilient exports. On one hand, there is a possibility of passive RMB appreciation: the Federal Reserve's resumption of rate cuts in September and the dovish trading brought about by the change in Fed Chairmanship have pressured the US Dollar Index, while the RMB’s appreciation against a basket of currencies has been notably weaker than that of the US dollar. Therefore, there is potential for passive RMB appreciation against the US dollar. On the other hand, this year, driven by industrial transformation and upgrading, the deepening and broadening of foreign trade markets, and the overseas capital expenditure cycle spurred by supply chain restructuring, China's export resilience has been strong. Meanwhile, the fact that PPI growth remains negative further enhances price competitiveness. However, imports have continued to decline due to weak domestic demand and domestic substitution effects, creating a stark contrast between hot exports and cold imports, which has led to a record-high trade surplus of USD 1,075.8 billion in the first 11 months. At the same time, the weakening of the US dollar has increased the willingness to convert large surpluses under the current account, and the year-end is traditionally a seasonal peak for such conversions. Thus, the record-high net conversion of USD 47 billion in October–November 2025 under the current account is not entirely unexpected, which may also have reinforced the recent appreciation trend.
In contrast, since October, the A-share and Hong Kong stock markets have corrected by 1.6% and 4.3%, respectively. Accelerating weakness in domestic demand, insufficient policy expectation increments, coupled with lingering concerns over bubbles in technology sectors, alongside event-driven shocks such as the conclusion of key meetings and liquidity disruptions caused by new benchmark regulations for public funds, have temporarily amplified bearish factors. However, the core issue remains the downward inflection point of fundamentals and the credit cycle.
In summary, we believe that similar to the second half of 2021, the recent divergence between equities and the currency is not due to differing views on growth: 1) the strengthening of the RMB may be more attributable to record-high trade surpluses being converted, and the recent dovish trading environment, combined with a weakening US dollar, has further boosted conversion demand, thereby reinforcing the RMB’s appreciation trend; 2) conversely, the stock market reflects the overall downward pressure on the economy following the weakening credit cycle.
How will the future unfold? Short-term tailwinds for the exchange rate remain, but a strong currency does not necessarily lead to a robust stock market.
As the preceding analysis suggests, the recent divergence between the stock and currency markets is precisely due to differing driving factors, and thus there is no contradiction.
However, whether one converges toward the other, or if convergence occurs at all, depends on: 1) How long the short-term factors causing the divergence will persist—for instance, Japan once experienced a five-year period of currency appreciation alongside a falling stock market; 2) The direction of the fundamental factors influencing both trends and whether they can return to alignment.
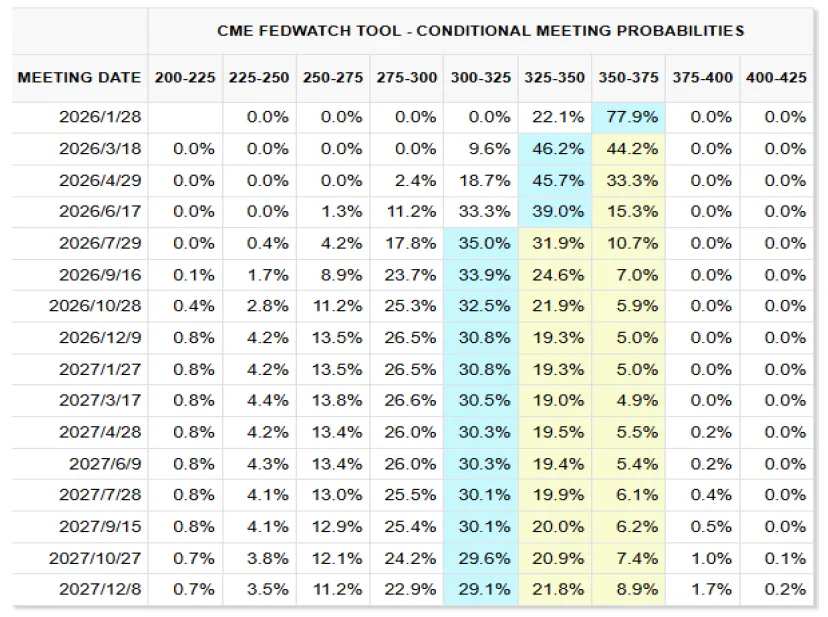
► How long the divergence lasts depends on how long the contributing factors endure. In the short term, favorable conditions for the exchange rate may still persist: Temporary “loosening trades” overseas and a more dovish stance from the new Federal Reserve Chair have led to expectations that need recalibration for the US dollar and long-term Treasury yields (the current market expectation is for only two rate cuts by 2026, but regardless of whether it’s Hassett or Warsh, the likelihood of rate cuts is higher). Seasonal factors such as foreign exchange settlement may continue to provide “tailwinds” for the exchange rate.
Chart: Current market expectations suggest the Fed may cut rates twice next year.
However, we would like to emphasize: On the one hand, a strong currency driven by non-fundamental factors does not necessarily lead to convergence in the stock market—otherwise, Japan would not have experienced a five-year period of strong currency and weak stocks. On the other hand, a continuously appreciating currency could be detrimental to China's current macroeconomic environment, characterized by weak domestic demand and persistent price stagnation.
Moreover, in the long run, whether the US dollar will continue to weaken and whether the willingness to settle foreign exchange will remain strong are debatable. Setting aside short-term expectations for loosening, the gradual repair of the US credit cycle—and possibly even overheating under certain conditions—may support the dollar and long-term Treasury yields. Historical experience shows that the movement of the dollar is highly correlated with the US growth differential relative to other countries. Under a baseline scenario where the US credit cycle begins to recover, the dollar is unlikely to weaken significantly. If the recovery in the credit cycle is strong or leads to overheating, the dollar may even strengthen slightly. Additionally, the net settlement ratio (net settlement vs. trade balance) was 33% in Q3 2025, still below the peak of 71% seen in Q4 2021.
Chart: As of Q3 2025, China’s current net settlement ratio remains below the peak seen in Q4 2021.
► Whether one converges toward the other still depends on the direction of the fundamentals driving their common trend. As we have analyzed in historical instances of divergence, whether stocks weaken to converge with a strong currency or a strong currency weakens to converge with weak stocks, the two seemingly different experiences are actually determined by the direction of the fundamentals: when fundamentals weaken, the exchange rate eventually weakens; when fundamentals strengthen, the stock market eventually strengthens.
The credit cycle remains the core factor in analyzing stock market performance. Whether it is the further decline in M1 growth or some fundamental data showing relatively mediocre performance, both can lead to weaker short-term relative performance in the equity market. This is also the main reason why we highlighted volatility concerns at the end of September and maintained our forecast for the Hang Seng Index at 26,000 points. From this perspective, the recent market pullback and weakness are not surprising. In our 2026 outlook for Hong Kong stocks, we concluded that, facing structural issues such as high base effects, declining income expectations, and persistently inverted cost of returns, unless fiscal policy accelerates significantly, China’s credit cycle is likely to experience fluctuations or even a阶段性下行. Previously, the repair of low base effects, favorable expectations around industrial structure and liquidity narratives somewhat “masked” these long-existing structural problems. As the momentum of these factors gradually dissipates, structural issues re-emerge. If this coincides with some capital flow and external disturbances, it may trigger a sentiment-driven pullback.
Chart: Without significant fiscal stimulus, China’s credit cycle may fluctuate or even decline next year
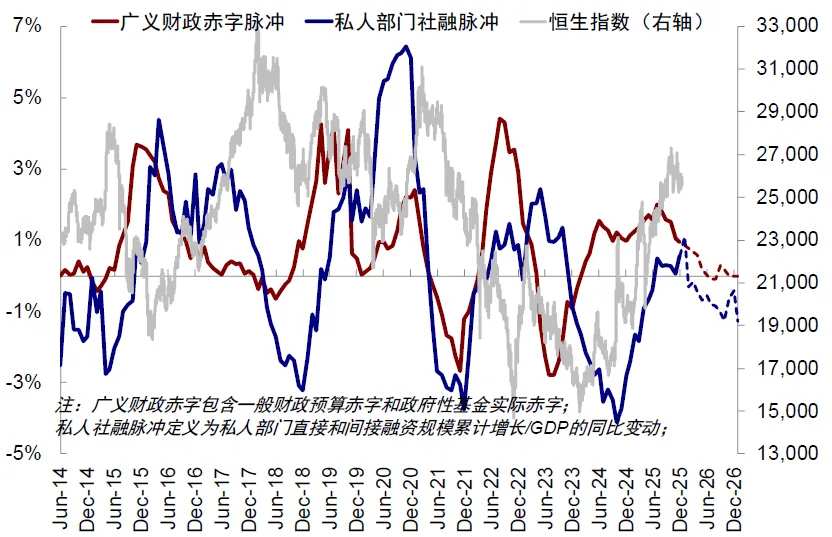
Chart: Meanwhile, the U.S. credit cycle may return to an expansionary trend next year
Looking ahead, 1) if fiscal policy maintains restraint, the current trajectory of the credit cycles in China and the U.S. suggests that a significant strengthening of the exchange rate lacks fundamental support. A rally driven solely by short-term sentiment and capital flows may face certain “ceilings”; 2) however, if fiscal policy becomes markedly more aggressive—especially through new policies focused on “cash flow” (income expectations, social security pensions, subsidy levels) and existing policies aimed at alleviating pressures (debt resolution and real estate stress)—this would lead us to become more optimistic about the prospects for a recovery in the credit cycle and overall equity markets. The appreciation of the RMB would then be supported by stronger fundamentals.
What are the market implications if the RMB continues to appreciate? Breaking through key thresholds in narrative sentiment could benefit import-oriented or service trade sectors, as well as companies with high dollar-denominated debt.
The appreciation of the RMB is the ultimate result of multidimensional factors such as capital flows, growth expectations, and policy changes. Its objective changes also serve as a cause influencing market performance. Many investors are focused on what impact this trend might bring to the market and industries if it persists, regardless of the reasons behind the appreciation.
First, the sentiment boost from breaking through key thresholds. The objective change in the RMB's appreciation, particularly when breaking through key 'thresholds,' may, in the short term, trigger 'grand narrative' trading and market movements among investors. This could boost market expectations at the short-term trading level, benefiting market narratives and bringing about a phase of resonance, similar to the capital inflow narrative between July and September. A weaker dollar environment is also more favorable for Hong Kong stocks. At this time, growth driven by sentiment may be more prominent, even sectors that the market 'believes' foreign capital prefers, such as consumer白马 (white horse) stocks. However, we note that if it is merely a narrative environment without fundamental support, its sustainability is questionable.
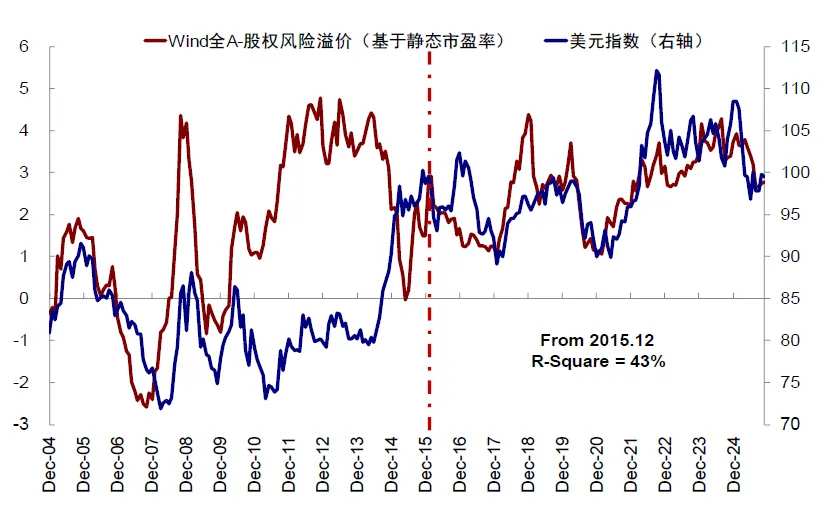
Chart: In terms of valuation, a weaker dollar may boost Hong Kong stock valuations through the risk appetite channel.
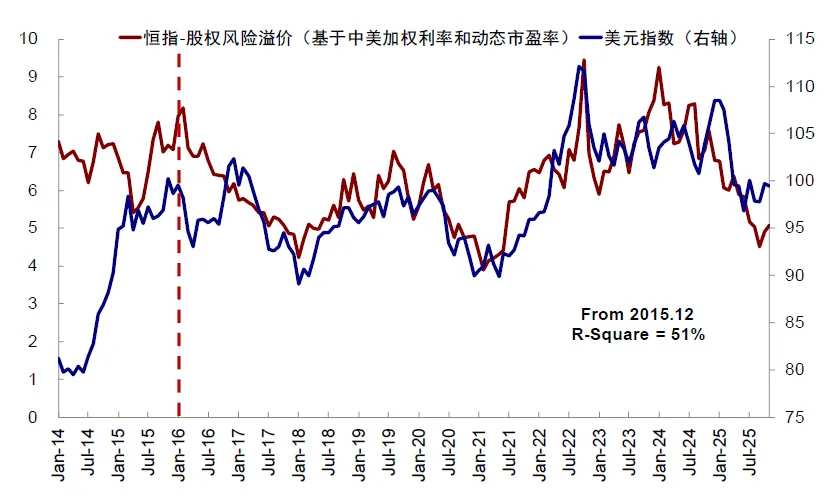
Chart: In terms of valuation, a weaker dollar may boost A-share valuations through the risk appetite channel.
Second, at the industry level: 1) The first is cost reduction, mainly benefiting import-dependent industries directly. Based on simple calculations using revenue data from industrial enterprises above designated size and import-export data disclosed by the National Bureau of Statistics and customs authorities, 'net importing' industries are primarily distributed in energy, agriculture, and materials sectors. 2) The second is the revenue side, manifested in the service trade sector, where industries such as aviation, duty-free, outbound tourism, etc., may benefit from RMB appreciation. 3) The third is the liability side, where companies with significant U.S. dollar debt may benefit from relatively reduced costs. Referring to the latest available data, targets with higher short-term liabilities in terms of U.S. dollar bonds within the scope of Stock Connect are predominantly found in internet, shipping, aviation, utilities, and energy industries. Conversely, RMB appreciation marginally disadvantages exports and does not help alleviate current downward price pressures.
 AI Positioning Advisor!Gain comprehensive insights into your holdings, fully grasp opportunities and risks with a single click.

Editor/Rocky