
The gold-to-silver ratio indicates the arrival of a period of excess returns for silver, with search volumes for 'how to buy silver' surging and frequent institutional inquiries at the $100 million level... A potential exponential rise driven by structural factors is poised to unfold.
Whether silver prices will break the $100 mark in 2026 has become a focal point for many precious metals market investment strategists. They have shifted their focus from traditionalTechnical indicatorsto structural currency dynamics. With the ongoing expansion of central bank balance sheets and geopolitical tensions reshaping the global trade landscape, silver has emerged as a unique combination of an industrial necessity and a monetary hedge. The convergence of supply constraints, accelerating technological demand, and currency depreciation has created a scenario that far surpasses the traditional precious metals cycle.
Modern portfolio theory traditionally categorizes silver as either a commodity or an inflation hedge, but new evidence suggests that this classification fundamentally misinterprets the asset's evolving role in the global economic system. The core issue facing both institutional and retail investors is not whether precious metals will appreciate, but how to devise strategies to address potential exponential volatility driven by structural rather than cyclical factors.
What does a three-digit silver price mean for investors?
1. How is the three-digit price threshold defined?
 A three-digit silver price refers to a price level above $100 per ounce, a threshold with profound implications for portfolio allocation and wealth preservation strategies. In December, international spot silver broke through $70 per ounce for the first time, bringing the metal within striking distance of this psychological and mathematical milestone.
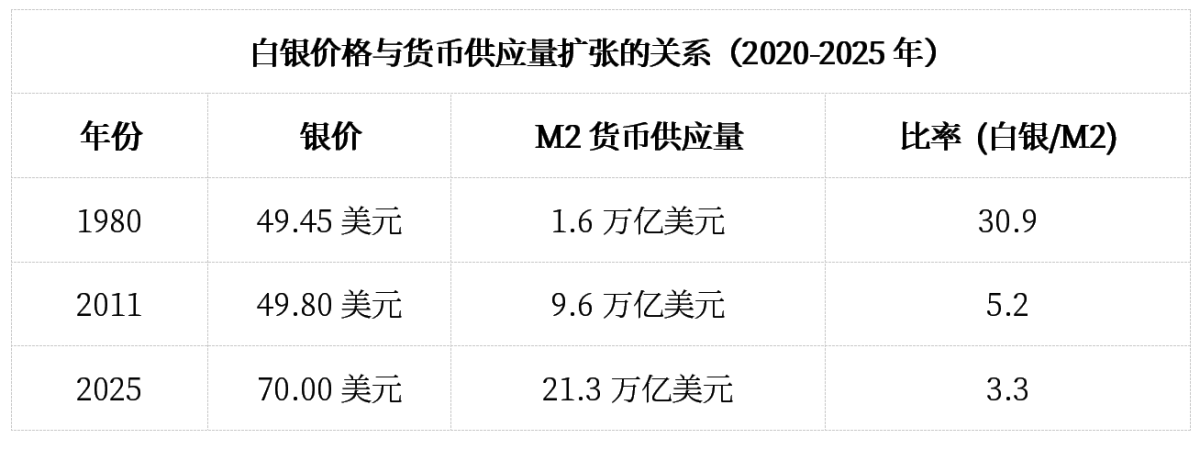
Its significance goes far beyond just a rise in price. Historical analysis shows that since silver peaked at approximately $49.45 per ounce in 1980, its purchasing power relative to monetary creation has significantly declined. Current monetary conditions indicate that achieving true inflation-adjusted parity would require a nominal price far higher than most market participants anticipate.
According to recent market analysis, compared to the expansion of M2 money supply rather than the traditional Consumer Price Index (CPI), silver prices remain about 11.8 times below their inflation-adjusted highs.
2. Analysis of Current Market Positioning
The mathematical model for silver reaching a three-digit price relies on multiple interconnected factors. Additionally, the gold-to-silver ratio provides crucial context for understanding current market positioning:
Current benchmark: $70/ounce (December 2025);
Required increase to reach $100: at least 43%;
Gold-to-silver ratio: currently below 65:1 (more than 120:1 below the historical high);
Historical average of the gold-to-silver ratio: 33-35:1 during periods of abundant inventory.
3. Why is 2026 a critical turning point?
The Federal Reserve's policy trajectory indicates that 2026 will still be within a rate-cutting cycle, which will create conditions historically associated with breakthroughs in precious metal prices. During periods of economic transition, particularly those involving changes in monetary systems, hard assets tend to experience exponential movements relative to fiat currencies.
The importance of the timeline stems from several interrelated factors. However, understanding whether silver prices can break into triple digits by 2026 requires examining broader market dynamics:
Economic cycle timing: Historically, the later stages of credit expansion often precede the revaluation of precious metals;
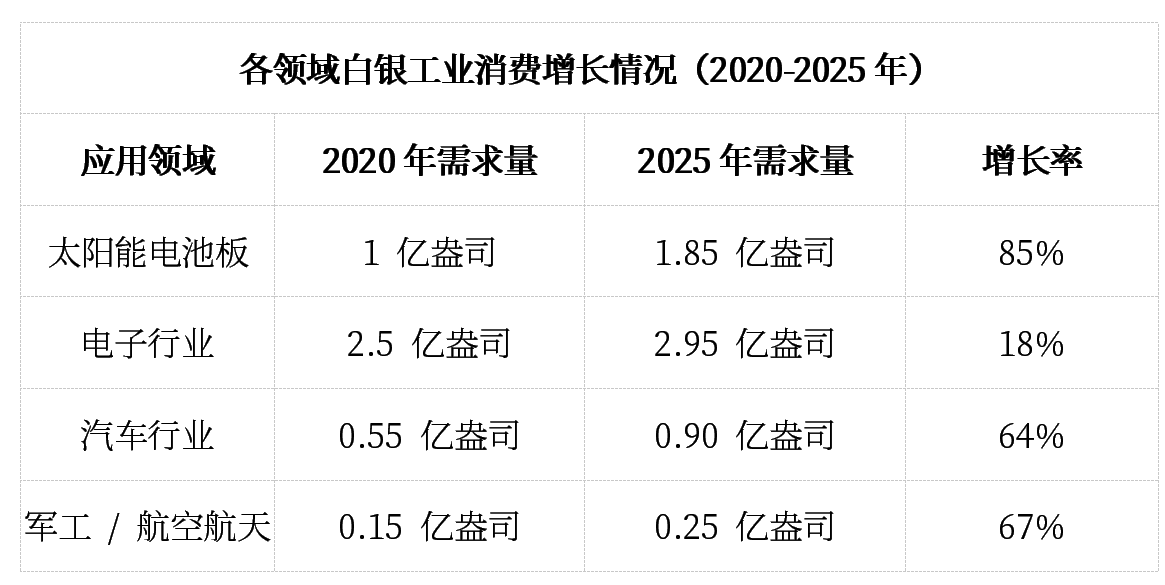
Acceleration of industrial demand: Critical thresholds reached in solar panel manufacturing and electric vehicle component demand;
Geopolitical realignment: As supply chain security becomes paramount, nations begin strategic metal stockpiling.
How far is silver from its inflation-adjusted high?
1. Analysis of the money supply gap
The traditional measurement of inflation using CPI data fundamentally misunderstands the relationship between silver and monetary expansion. Since 1980, the Federal Reserve's M2 money supply has expanded from approximately 1.6 trillion USD to over 21 trillion USD by 2025, increasing 13-fold, far surpassing conventional inflation indicators.
When the current price of silver at 70 USD is adjusted for monetary base expansion rather than CPI, the metal is trading at a significant discount relative to its peak purchasing power. This analytical framework suggests that achieving monetary parity would require prices substantially higher than the nominal high of 49.45 USD in 1980.
2. Measurement of real versus nominal performance
The disconnect between nominal price recovery and the restoration of purchasing power highlights the potential scale of upward scenarios. Despite silver reaching new nominal highs in 2025, its position relative to money creation indicates that the metal remains in the early stages of a major revaluation cycle.
Silver's current position relative to M2 expansion suggests that the metal would need to reach approximately 585 USD per ounce to match its 1980 purchasing power against currency.
What supply constraints are pressuring the silver market?
1. Crisis of depleted government reserves
The status of global strategic silver inventories is one of the most overlooked fundamental factors supporting the rise in silver prices. Countries with historically large silver reserves have gradually depleted these stocks over decades through technological advancements and strategic sales. Key developments include:
The U.S. strategic silver reserve has been completely exhausted;
China has implemented export restrictions and licensing requirements by 2025;
EU countries have reported minimal remaining strategic silver reserves;
Military applications continue to deplete available materials for advanced weapons systems.
2. Analysis of Accelerating Industrial Demand
Modern technological applications have transformed silver from a monetary metal into an industrial necessity. The expansion of solar energy, the proliferation of electric vehicles, and the coordinated development of advanced electronics manufacturing have collectively created structural demand growth that outpaces supply responses from traditional mining.
Furthermore, analysts examining the issue of silver supply shortages have pointed out that accelerating demand growth is placing unprecedented pressure on existing inventories.
3. Challenges Facing Mining Production
The precious metals mining industry faces structural challenges that limit the supply-side response to rising prices. Capital allocation decisions made during the low-price period from 2015 to 2020 have resulted in a development gap that will take 5-7 years to address through new mine construction.
Key production constraints:
Declining ore grades: Since 2010, the average grade of silver ore has decreased by 20%;
Development cycle: A new mine requires 5 to 7 years from discovery to production.
Capital intensity: Modern silver mines require an initial investment of over 500 million US dollars.
Environmental permits: The regulatory approval process can extend the development cycle.
Considering that 70% of silver production is a byproduct of copper, lead, and zinc mining, the issue of mining supply shortages becomes even more pronounced. When base metal prices fall, silver production will automatically decline regardless of the price level of silver.
How do market indicators signal potential breakthroughs?
1. Gold-silver ratio technical analysis
The current gold-silver ratio is below 65:1, significantly lower than the level exceeding 120:1 during the market stress period in 2020. Historical analysis shows that a narrowing gold-silver ratio typically signals that silver prices are entering a phase of excess returns, while breaking below 50:1 may indicate exponential acceleration in silver prices. The historical trend of this ratio is as follows:
1979-1980: As silver prices surged to $49.45 per ounce, the ratio decreased from 40:1 to 17:1;
2010-2011: During the period when silver prices rose to $49.80 per ounce, the ratio dropped from 70:1 to 31:1;
2025: The current ratio being below 65:1 indicates the early stage of a compression phase.
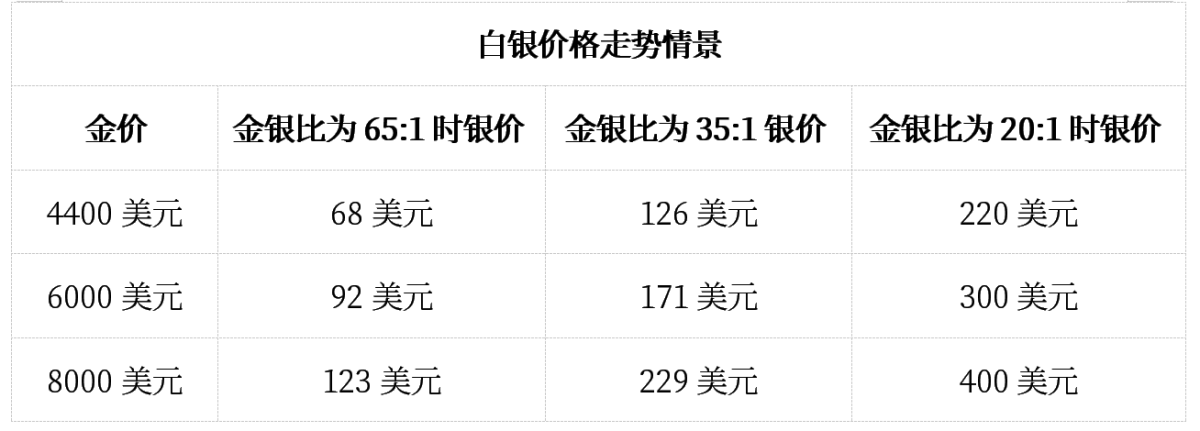
When the gold-to-silver ratio reaches its historical average of 33-35:1, based on the current gold price of $4,400 per ounce, the silver price will range between $126 and $140 per ounce. If the gold-to-silver ratio reaches the extreme level of 20:1 briefly seen in 1980, it would imply a silver price exceeding $220 per ounce.
2. Retail Investor Interest and Search Behavior Patterns
Google Trends data shows a correlation between surges in search volumes for precious metals-related terms and significant turning points in prices. For instance, the search term “how to buy silver” reached an all-time high in December 2025, coinciding with historically significant market inflection points.
Moreover, recent analysis by Kitco News indicates that retail participation tends to increase during the early stages of major price movements.
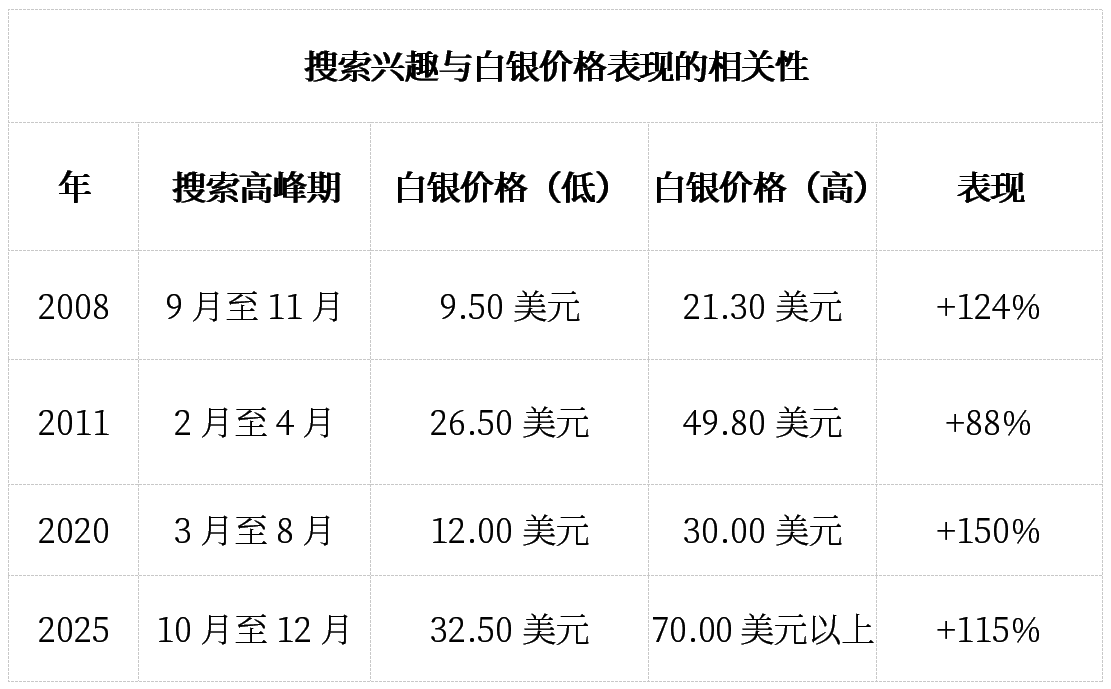
This correlation in search patterns suggests that retail participation rises during the early phases of significant market volatility rather than at market peaks, contradicting the conventional view that “dumb money” fails to time the market.
3. Institutional Positioning Signals
In 2025, the trend of institutional investors aggressively accumulating physical silver has continued to accelerate. ETF flow patterns show four consecutive weeks of inflows, while physical silver dealers report supply constraints at current price levels.
However, the potential for a squeeze in the silver market remains a significant factor in institutional positioning decisions. Indicators of institutional activity include:
As of December 2025, silver ETF holdings have increased by 15% year-to-date;
The premium for physical silver over spot prices has widened to a range of 8-12%;
Multiple dealers reported inquiries regarding bulk commodity purchases (transactions exceeding 100 million USD).
Discussions on central bank digital currencies include provisions supported by precious metals.
Based on market intelligence, recent institutional inquiries involve the execution strategy for purchasing approximately 100 million USD worth of silver, indicating that sophisticated funds anticipate further increases in silver prices.
What economic conditions could drive silver prices to break into triple digits?
1. Monetary Policy Catalyst Scenarios
The Federal Reserve's policy trajectory for 2026 is expected to include a potential rate-cutting cycle, as concerns over economic growth will outweigh inflation targets. Historically, environments with real interest rates close to zero or negative have been closely associated with phases of rising precious metal prices. The three key scenarios for Federal Reserve monetary policy are as follows:
Baseline scenario: Two rate cuts in 2026, reducing the federal funds rate to 3.5%-4.0%;
Aggressive scenario: Economic slowdown forces interest rates below 3%, leading to negative real interest rates;
Crisis scenario: Financial system stress forces an emergency rate cut to zero.
Each scenario would create increasingly favorable conditions for silver appreciation, while the crisis scenario might trigger exponential growth as investors seek alternatives to depreciating currencies.
2. Market Adjustments and Safe-Haven Demand
Current equity valuations and debt levels suggest the possibility of a significant stock market correction by 2026. Historical analysis indicates that precious metals tend to perform well during periods of stock market stress, particularly when corrections exceed 20% from their peak.
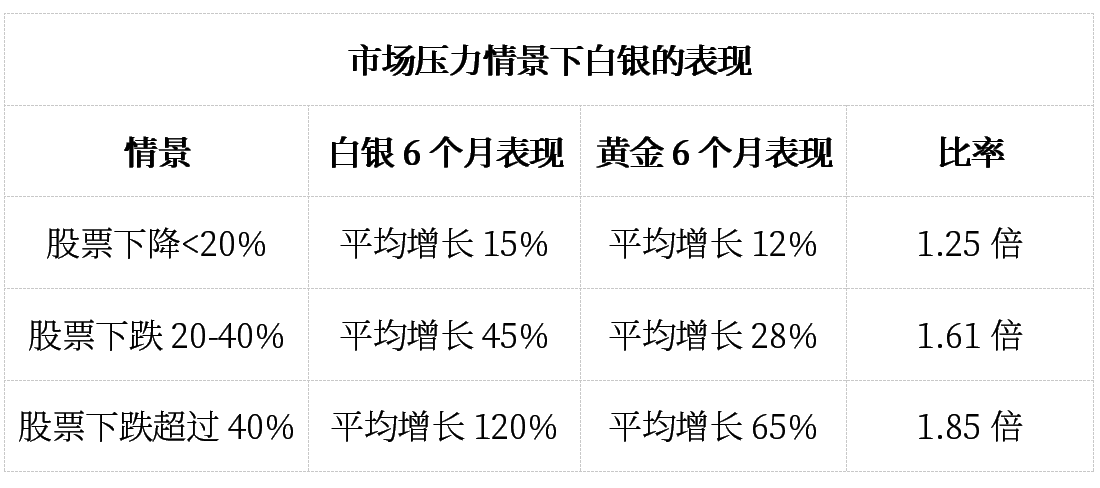
As market pressures intensify, silver’s excess returns are likely to increase, highlighting its leveraged characteristics which become more pronounced during crisis periods.
3. Impacts of Geopolitics and Trade Wars
Strategic metal reserves held by various countries may create additional demand pressure while reducing available commercial supply. Export restrictions imposed by major producing countries (China, Peru, Mexico) could lead to supply shortages, thereby disrupting traditional price discovery mechanisms.
Furthermore, analysis of the impact of tariffs on silver suggests that changes in trade policies may accelerate price volatility in 2026. The following factors underscore silver’s strategic reserve importance:
Silver is crucial for advanced weapon systems in military applications;
National security considerations in the technology sector;
Monetary support for central bank digital currency initiatives;
Economic warfare through the control of critical materials;
Which price models support the forecast of a triple-digit silver price?
1. Mathematical Ratio Regression Model
The potential movement of gold prices towards $6,000 to $8,000 per ounce provides mathematical model support for silver prices reaching triple digits. Combined with historical gold-to-silver ratio analysis, these models indicate that silver's appreciation potential will far exceed that of gold. The scenario analysis derived from the potential changes in the gold-to-silver ratio is as follows:
Conservative estimate (Gold-to-Silver ratio of 50:1, Gold price at $6,000): Silver price will reach $120;
Historical case (Gold-to-Silver ratio of 35:1, Gold price at $7,000): Silver price will reach $200;
Extreme scenario (Gold-to-Silver ratio of 20:1, Gold price at $8,000): Silver price will reach $400.
If the gold-to-silver ratio returns to its historical average while the gold price continues to advance beyond $8,000, silver’s performance may outpace gold by six times or more.
2. Supply-Demand Gap Forecast
Industry analysis indicates that by 2030, the annual silver deficit will persistently reach between 150 million and 200 million ounces, exceeding the total above-ground stockpiles. This mathematical model suggests that as physical shortages emerge, the price elasticity curve will become increasingly steep. The impact analysis of the silver supply deficit is as follows:
2026: Deficit of 180 million ounces, accounting for 5% of above-ground reserves;
2027: Shortfall of 195 million ounces, cumulative consumption at 10%;
2028: Shortfall of 210 million ounces, cumulative consumption at 16%;
2029-2030: Industrial demand intensifies, leading to an accelerated expansion of the shortfall.
The price elasticity model indicates that physical shortages can cause exponential rather than linear price movements, potentially triggering triple-digit price fluctuations in a short period.
3. Currency Reset Scenario
Central bank digital currency proposals may include precious metal-backed provisions to maintain public confidence. If major economies adopt partially backed digital currencies, the required accumulation of precious metals could equate to multiple years of mining output.
The Nixon Shock of 1971 provides relevant context for sudden changes in the monetary system. Between 1971 and 1980, the price of gold surged from $35 per ounce to $850, representing a 2,300% increase, illustrating how changes in the monetary regime can trigger exponential growth in precious metal prices.
If central bank digital currencies require partial backing by precious metals, or if international trade settlement mechanisms shift toward hard assets, similar dynamics could impact silver.
What risks are associated with triple-digit silver price forecasts?
1. Economic Growth Slowdown Scenario
A severe economic recession could reduce industrial silver demand in areas such as solar panel manufacturing, electric vehicle production, and electronics applications. Historical analysis indicates that during periods of economic stress, declines in industrial demand can offset increases in investment demand. However, there are some risk-mitigating factors for silver:
Government infrastructure spending typically sustains demand for solar energy and electric vehicles during a recession.
Military applications are unaffected by economic cycles and remain stable.
A decline in mining output during a recession provides support for silver prices on the supply side.
During policy responses to recessions, currency depreciation accelerates.
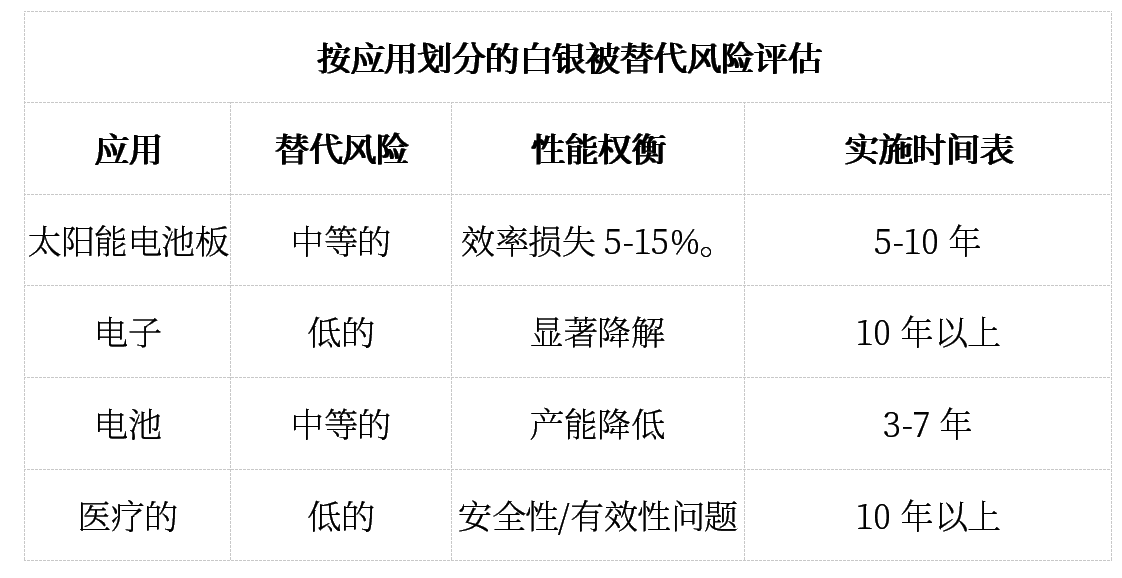
2. Threat of Technological Substitution
Research into substitutes for silver in industrial applications poses a long-term risk to demand forecasts. However, current substitutes generally perform poorly and require significant investment in industrial equipment modifications.
3. Risk of Market Manipulation and Intervention
Concentration of positions in futures markets and potential interventions by central banks pose risks to exponential increases in silver prices. However, if industrial demand depletes existing supplies, physical silver shortages may offset the impact of manipulation in the paper silver market. Potential limiting factors include:
Government reserves have been depleted, reducing intervention capacity.
Industrial demand provides a fundamental support for prices that is unaffected by speculation;
The international coordination required for effective manipulation has become increasingly difficult.
How should investors position themselves to respond to the potential breakout in silver prices?
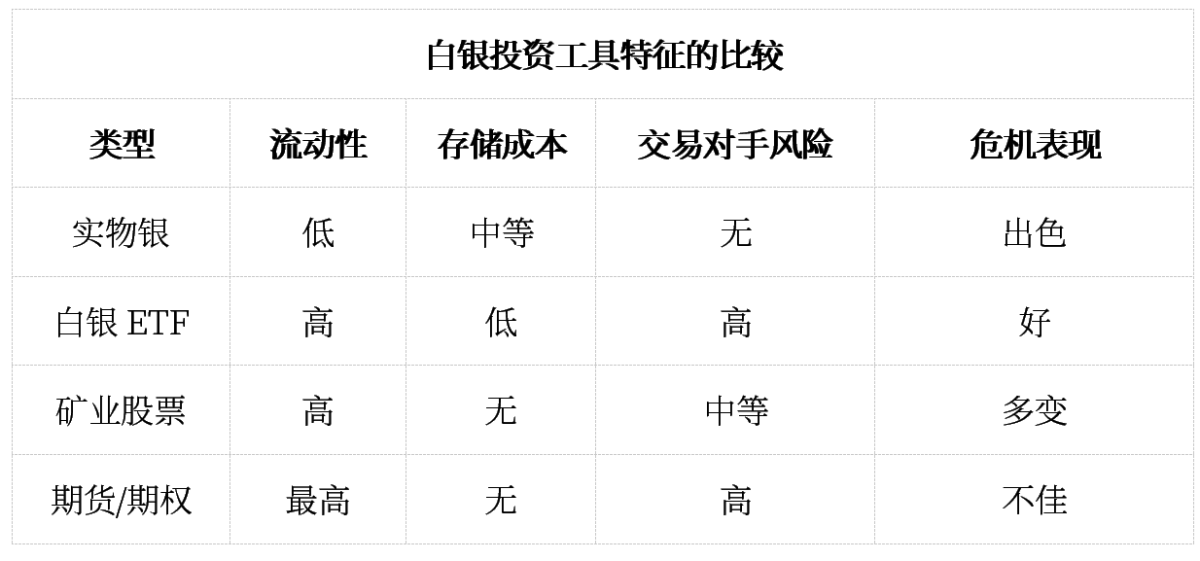
1. Considerations for physical silver versus paper silver
Holding physical silver provides direct access to investment opportunities without counterparty risk, while ETFs and mining stocks offer liquidity advantages under normal market conditions. However, supply shortages during crisis periods may lead to significant premiums on physical silver.
Furthermore, an analysis of silver premiums provides investors with important considerations when choosing between different silver investment instruments.
2. Timing and dollar-cost averaging strategies
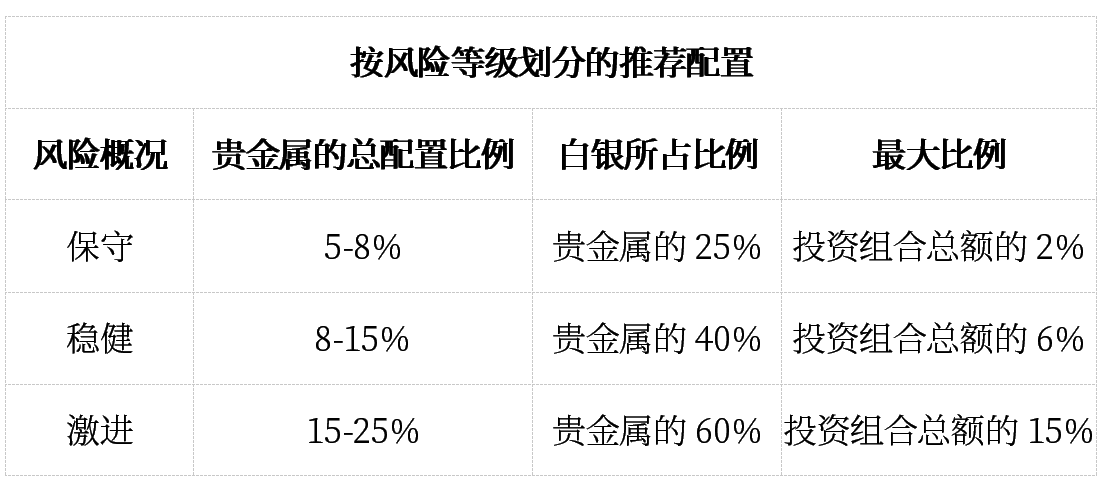
When betting on exponential increases in silver prices, volatility management is crucial. Dollar-cost averaging can reduce timing risks while maintaining exposure to potential breakout opportunities. The main strategic allocation framework is as follows:
Conservative strategy: Precious metals allocation ratio of 5-10%, with a gold/silver ratio of 60/40;
Balanced strategy: Allocation ratio of 10-20%, with silver weight increased to 50%;
Aggressive Strategy: Allocation ratio exceeds 20%, with a focus on the leverage characteristics of silver.
Position size should reflect individual risk tolerance, but note that during periods of supply shortages, silver first becomes difficult to obtain and then unaffordable.
3. Portfolio Allocation Guidelines
The position size adjusted for risk needs to consider the correlation of silver with other assets under different market conditions. Historical analysis shows that precious metals can provide portfolio diversification benefits, which are more pronounced during crisis periods.
Frequently Asked Questions: Considerations When Betting on Triple-Digit Silver Prices
1. Is it realistic for silver prices to reach triple digits by 2026?
Mathematical analysis based on monetary supply expansion, industrial demand growth, and the historical relationship between gold and silver indicates that triple-digit silver prices are not far-fetched but rather a reasonable scenario. The convergence of supply constraints, monetary policy, and geopolitical factors has created conditions similar to previous periods of precious metal price surges. Below are the assessment factors supporting the probability of silver reaching triple-digit prices:
Supply Shortages: Annual deficits approach 200 million ounces;
Monetary Environment: M2 expansion exerts pressure for currency depreciation;
Industrial Demand: Growing demand for silver in solar and electric vehicle industries.
Geopolitical risks: Export restrictions lead to supply uncertainty.
What factors could drive silver prices above $100?
Specific catalysts that could push silver prices into triple digits include a reversal of Federal Reserve policy, physical supply shortages impacting industrial users, or geopolitical events disrupting major production regions. Key indicators to monitor are as follows:
Real interest rates near zero or negative;
Reductions in ETF inventories signaling physical shortages;
Delivery delays or cancellations reported by industrial users;
Announcements regarding central bank digital currencies, including those backed by precious metals.
How should beginners start investing in silver?
New precious metal investors should prioritize learning and understanding the unique characteristics of silver compared to traditional financial assets before allocating capital. Beginner strategies are as follows:
Learning phase: Study the history of money and foundational knowledge about precious metals;
Initial Allocation: The weight of physical silver in the initial investment portfolio is set at 1-2%.
Gradual Expansion: Increase allocation based on comfort level and market conditions.
Storage Planning: Arrange a secure storage solution before making bulk purchases.
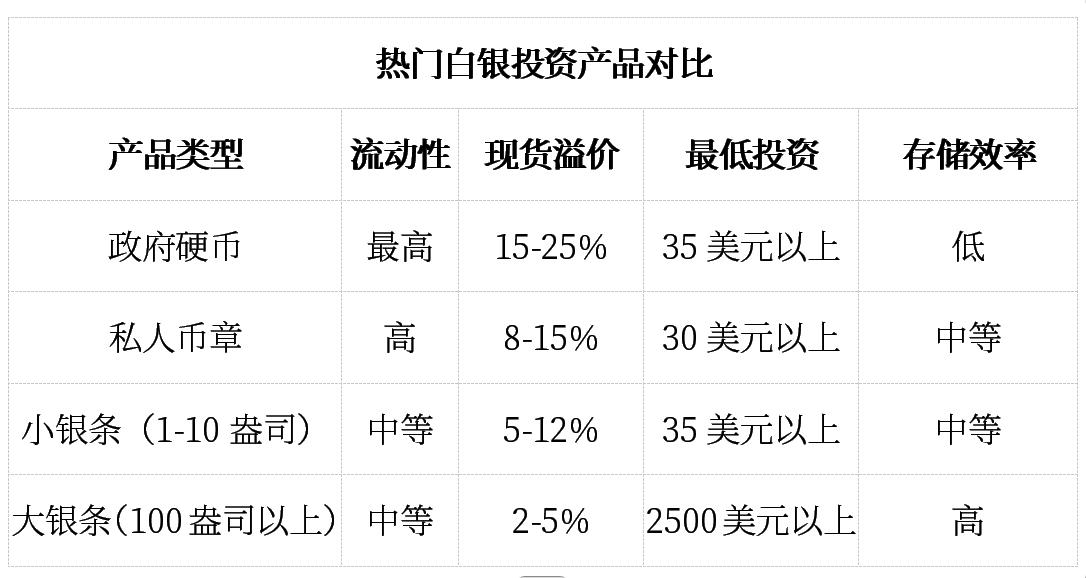
4. What is the difference between silver coins and silver bars?
Silver coins offer higher liquidity and greater recognition advantages, while silver bars provide lower premium costs for large-scale investments. Government-minted silver coins have legal tender status, offering additional authenticity guarantees.
Evaluation of Betting on Triple-Digit Silver Prices
1. Probability Framework Analysis
Weighing bullish versus bearish scenarios requires a systematic analysis of fundamental drivers, technical indicators, and macroeconomic conditions. The combined effects of supply constraints, monetary expansion, and accelerating industrial demand create a more compelling case for silver appreciation than traditional technical analysis alone.
Thus, industry experts' forecasts of silver prices reaching triple digits support the aforementioned mathematical framework. The risk-reward assessment is as follows:
Upside Potential: Appreciation potential of 300%-500% within 2-3 years.
Downside scenario: A decline of 20%-30% during an economic slowdown;
Base case expectation: Driven by supply and demand fundamentals, gains are projected to range between 50% and 100%.
The asymmetric risk-return profile favors the allocation of precious metals, particularly for investors seeking portfolio diversification and inflation hedging.
2. Key Monitoring Indicators
Successfully timing silver investments requires close monitoring of specific economic indicators, market signals, and supply-demand metrics, as these factors often signal significant price movements. Therefore, when considering whether silver prices will surpass triple digits by 2026, investors should pay close attention to these critical factors. Below is a monthly checklist for assessing the health of the silver market:
Communication on monetary policy by the Federal Reserve and trends in real interest rates;
ETF inventory levels and patterns of institutional capital flows;
Reports on industrial demand from the solar and automotive sectors;
Latest developments in mining production and levels of exploration investment;
Technical analysis and historical comparison of the gold-silver ratio;
Geopolitical developments affecting major production areas;
Regular evaluation of these indicators can provide early warning signals for opportunity identification and risk management in precious metals investment.
The content of this article is provided by Muflih Hidayat, a precious metals analyst at the investment information service company DiscoveryAlert.
Editor/melody