
Source: CICC Insights
Authors: Li Zhao, Yang Xiaoqing
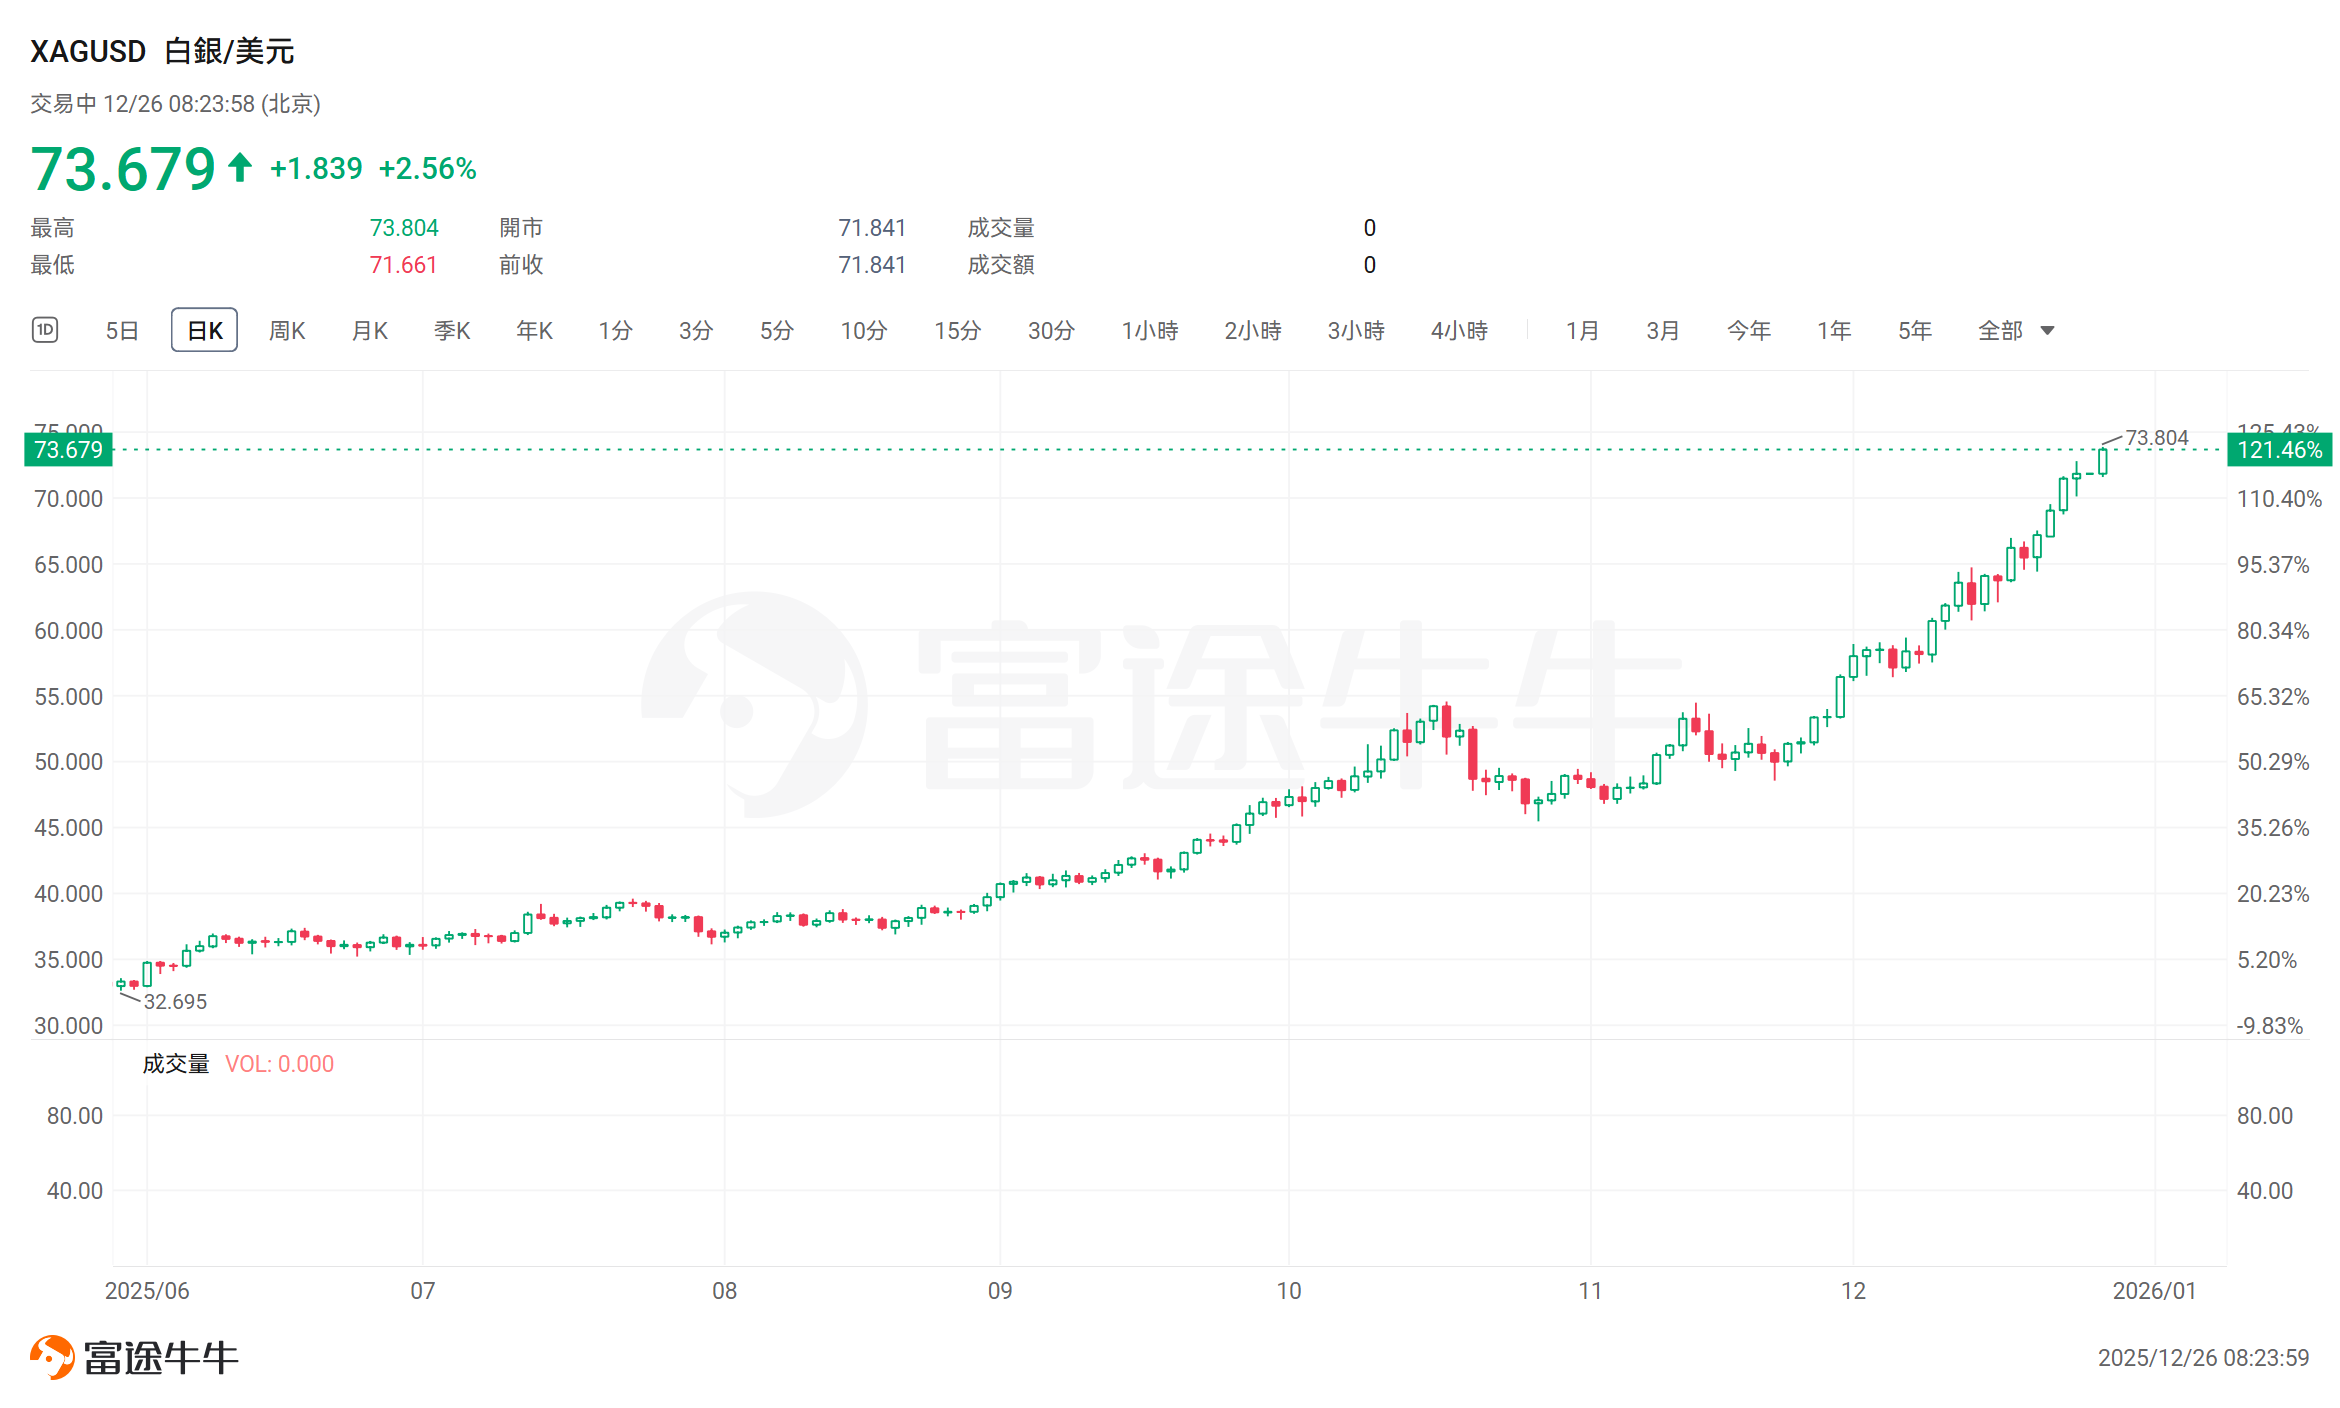
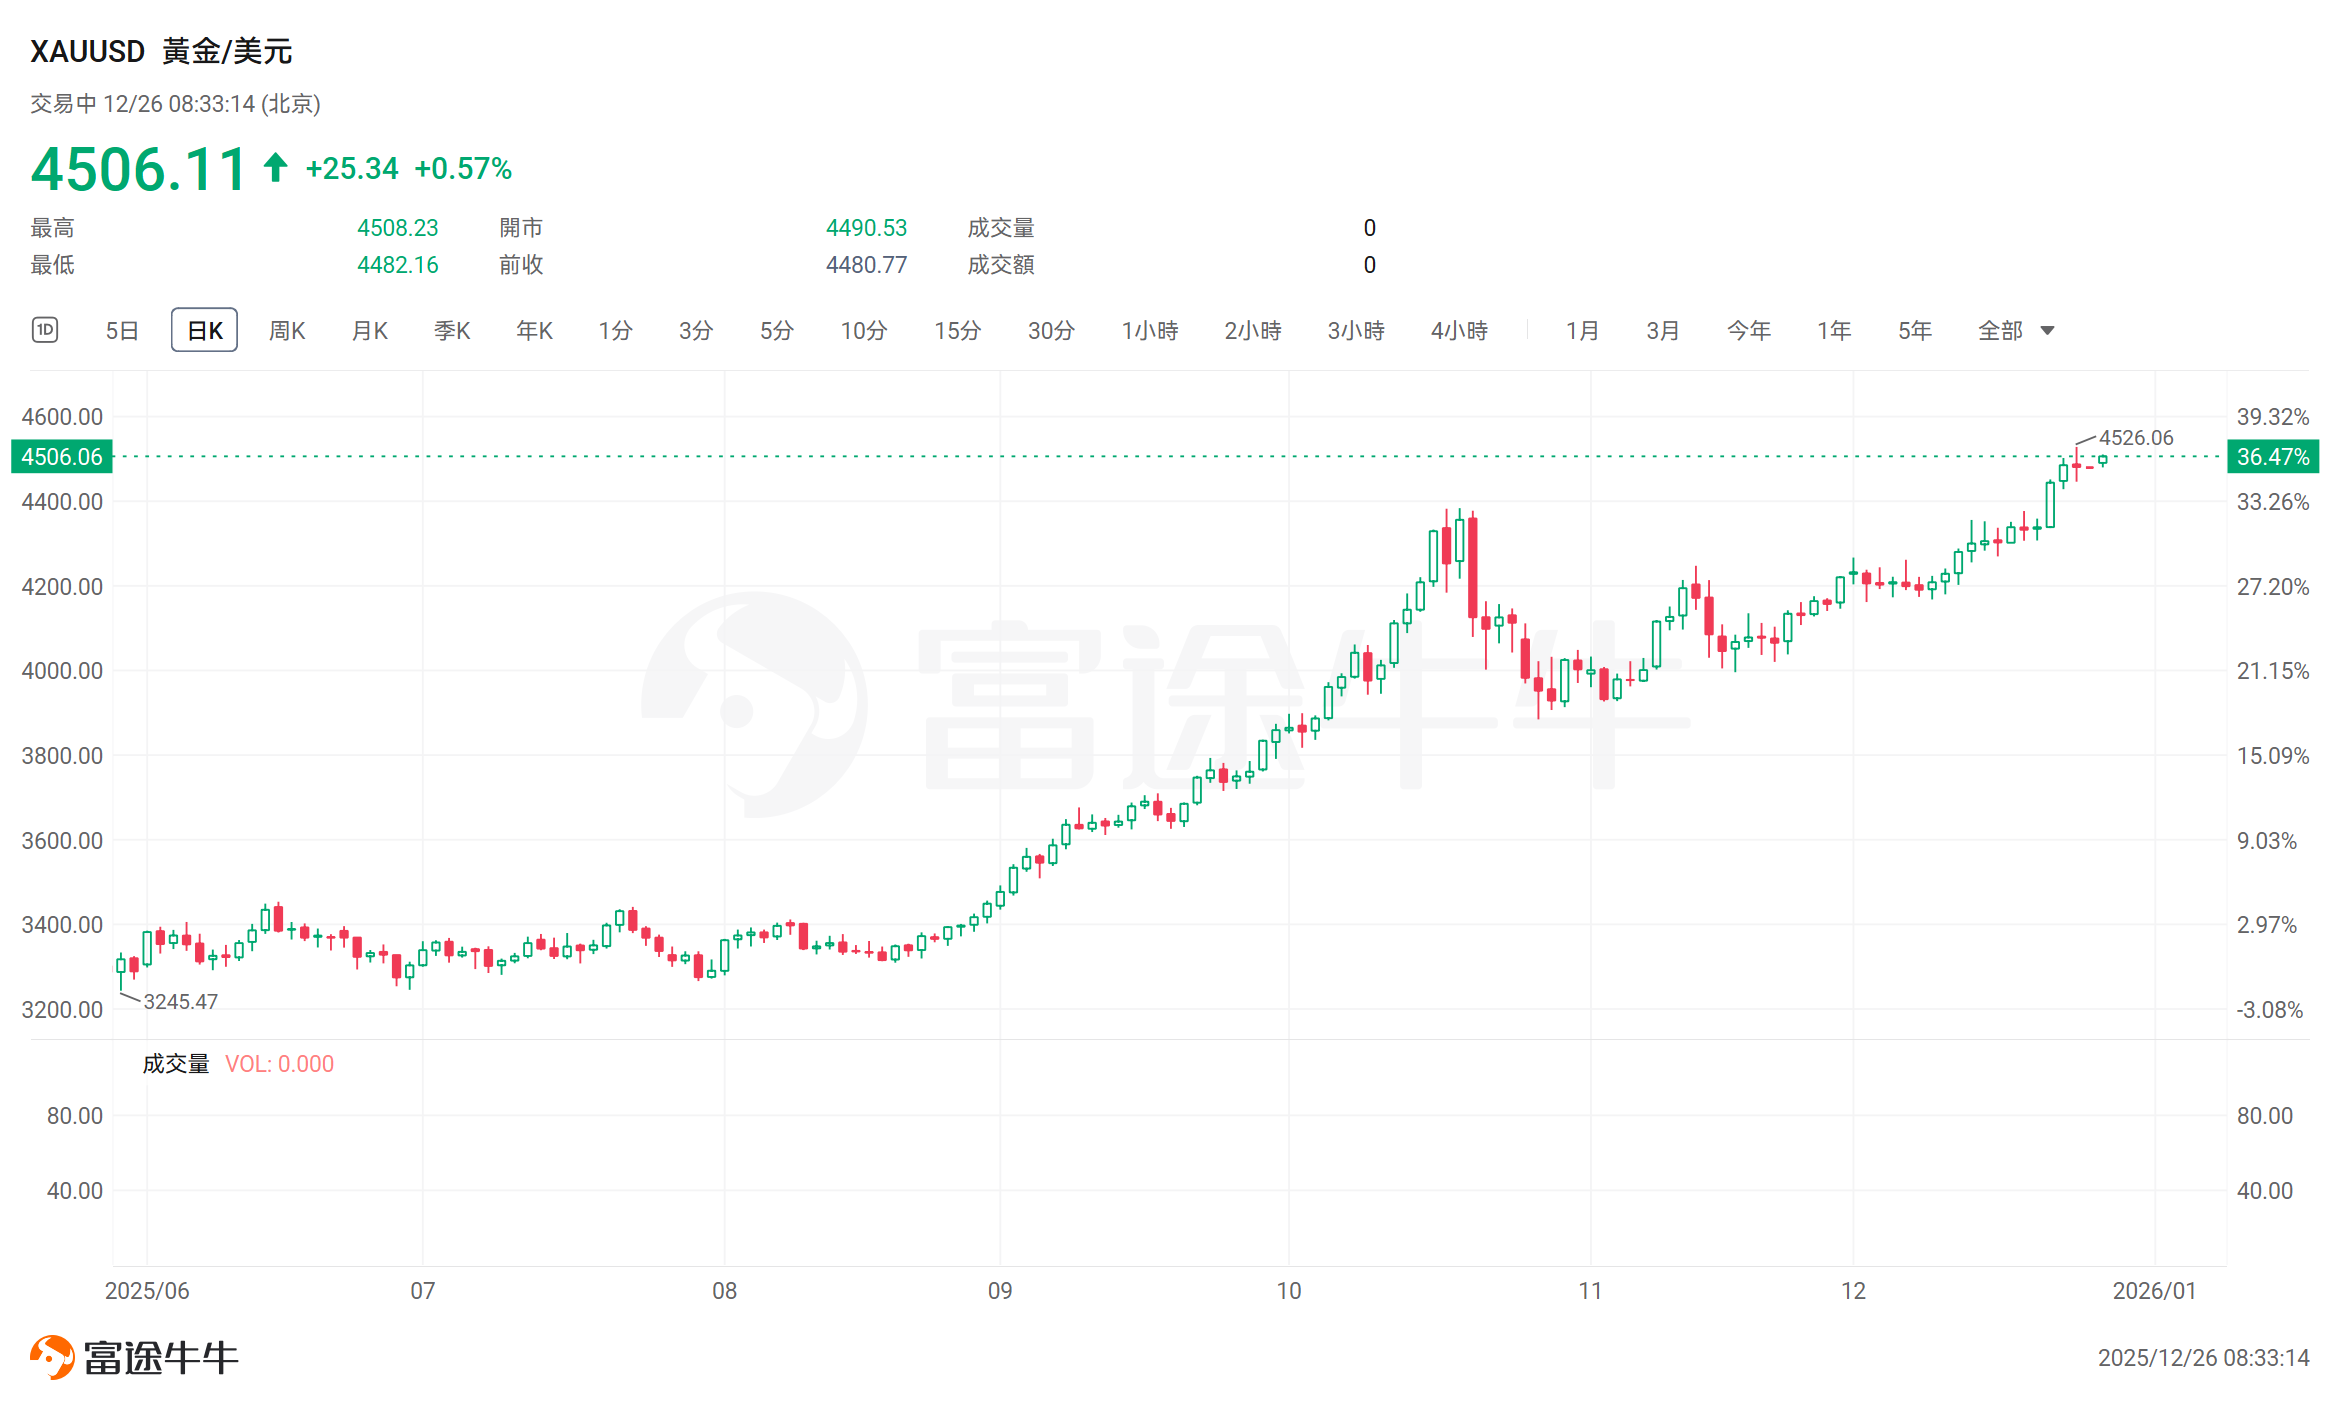
Today, $XAG/USD (XAGUSD.FX)$ Surged another 2%, breaking through 73 USD/ounce; $XAU/USD (XAUUSD.CFD)$ It broke through the $4,500 mark on Wednesday and is currently experiencing high volatility.
Why has gold surged significantly?
 Recently, the price of gold surged past $4,500 per ounce, setting another all-time high. This is supported by three key factors: first, the Federal Reserve has restarted an easing cycle. After maintaining the policy interest rate unchanged for nine months, the Fed resumed rate cuts in September this year, implementing three consecutive 25-basis-point cuts. Additionally, it announced the purchase of short-term Treasury bonds starting in December to expand the central bank's balance sheet and inject liquidity into the market. Looking ahead to 2026, the Fed’s forward guidance suggests further rate cuts may occur next year. The overall monetary policy direction trending toward easing supports gold's performance.
Chart: The Federal Reserve resumed rate cuts in September this year, implementing three consecutive 25-basis-point cuts.
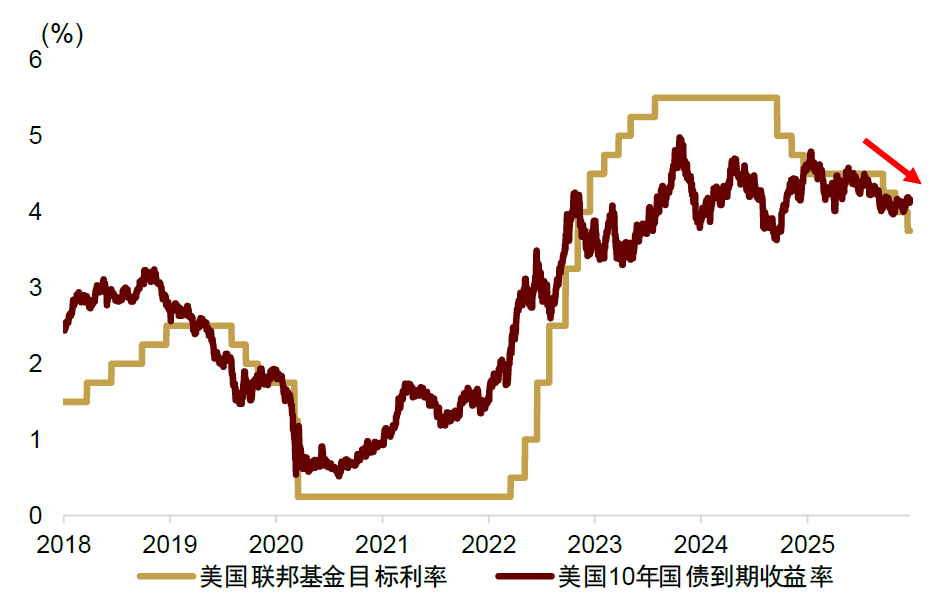
Data Source: Wind, CICC Research Department
Second, the credibility of the U.S. dollar has declined. Following the pandemic, the U.S. fiscal deficit ratio rose to around 6%, far higher than its pre-pandemic level, leading to rapid accumulation of national debt and rising debt risks. Moreover, recent interventions by President Trump into the Fed’s decisions have increased. Current Fed Chair Powell will step down in May 2026, and Trump is set to nominate a new Fed Chair, raising investor concerns about a potential decline in the Fed’s independence. These fiscal and monetary factors combined have eroded investor confidence in the dollar system and dollar-denominated assets, pushing the dollar into a depreciation cycle, with the dollar index having fallen approximately 10% this year. Gold possesses monetary attributes and serves as an alternative to the current dollar-based system, benefiting from the erosion of dollar credibility.
Chart: The dollar index began a depreciation cycle at the start of 2025.
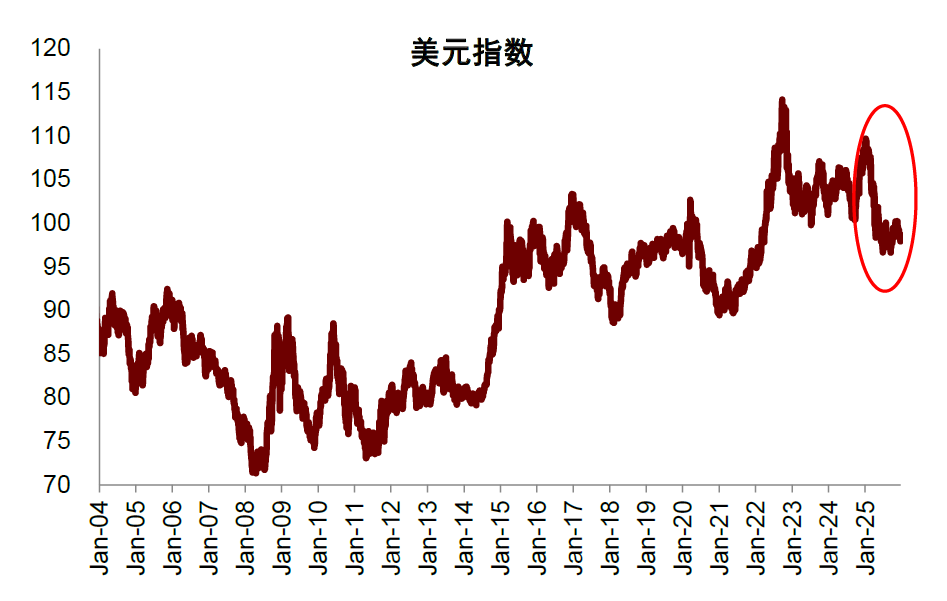
Data Source: Wind, CICC Research Department
Finally, global geopolitical risks have escalated. Recently, U.S. sanctions on Venezuela’s oil exports have evolved into actual maritime interception operations [1]. Meanwhile, Ukrainian drones attacked critical energy export infrastructure along Russia’s Black Sea coast, leaving the Russia-Ukraine conflict in a negotiation deadlock [2]. Gold, known for its safe-haven properties, benefits relatively during such times. While gold has surged, silver has risen even more sharply, likely influenced by industrial supply-demand dynamics. Silver, which has industrial applications, is highly sensitive to manufacturing cycles and the renewable energy sector. In 2025, demand for silver in global photovoltaic installations, electric vehicles, and electronic and electrical equipment sectors will continue to rise, while limited expansion on the supply side has tightened the supply-demand balance marginally.
How long will gold continue to rise?
This gold bull market has persisted for three years, with prices increasing 2.7 times. Market narratives are now emerging that frame gold’s rise as a prolonged trend. CICC’s multi-asset team has recommended overweighting gold for three consecutive years since the fourth quarter of 2022. However, we believe gold prices will not rise indefinitely, and shifts between bull and bear markets are normal. Investment decisions should not be guided by grand narratives but rather by objective data-driven analysis of asset behavior patterns. Our review of major global asset classes shows that the durations of gold’s bull and bear markets are relatively balanced, with individual bear markets being the longest-lasting among major asset classes.
Chart: Statistics on the duration and magnitude of bull and bear markets for major global asset classes.
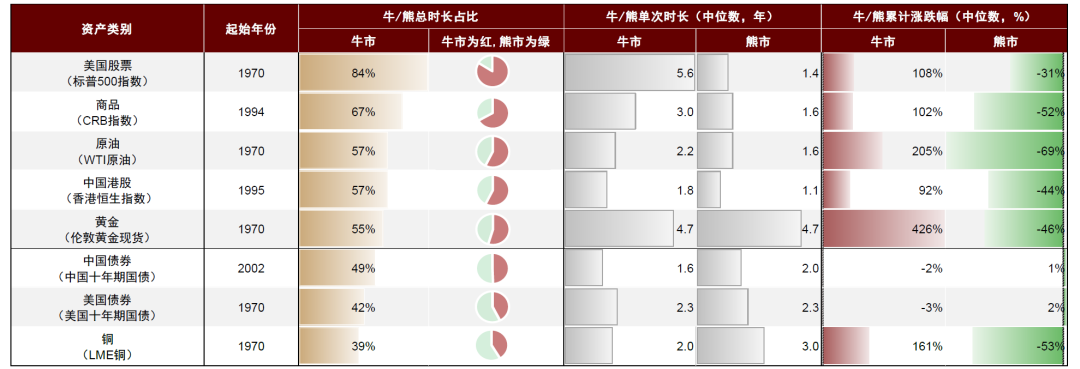
Note: The A-share, Hong Kong stock, and US stock markets are defined as bull markets when gains exceed 20% for durations of more than six months; the remaining periods are considered bear markets. Chinese bonds and US bonds are defined as bear markets when yield increases exceed 75 basis points for durations of more than six months; the remaining periods are considered bull markets. Commodities, copper, gold, and crude oil are defined as bull markets when yield increases exceed 30% for durations of more than twelve months; the remaining periods are considered bear markets. Turning points are identified as follows: Bear markets begin from the day of the peak, and bull markets begin from the day of the trough. Bond price fluctuations reflect changes in interest rates.
Data Source: Wind, CICC Research Department
Therefore, after a significant three-year rally in gold, it is now necessary to study the general patterns that mark the end of a gold bull market and prepare accordingly. In "Major Asset Classes Outlook for 2026: Building Momentum", we conducted a systematic review of the tops of five historical gold bull markets and found that clear signals of monetary tightening by the Federal Reserve and fundamental improvements in the US economy (upward growth, downward inflation) were the most effective indicators of a bull market top.
Chart: Patterns at the Top of Gold Bull Markets: Federal Reserve policy signals are relatively accurate, with lower difficulty in identifying tops compared to equities.
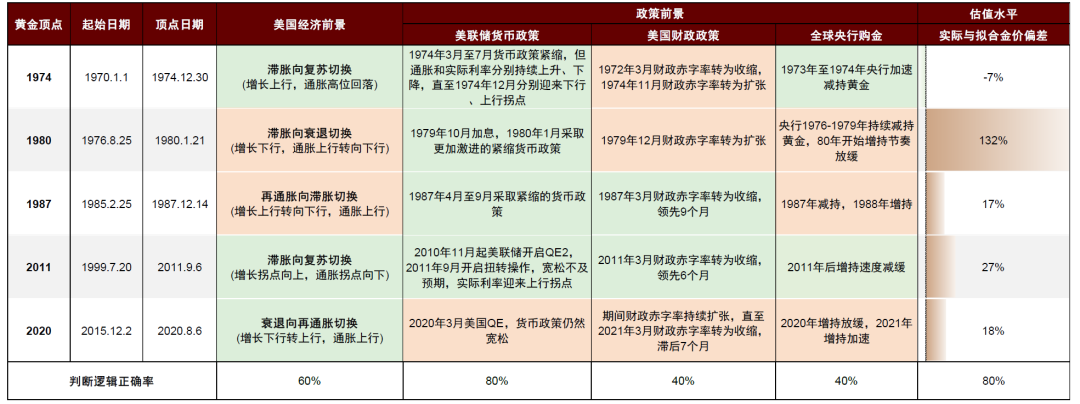
Note: 1) Deviations between actual and fitted gold prices are calculated based on residuals from the gold valuation model and fitted gold prices. 2) Green-filled cells indicate signals unfavorable to gold, while red indicates signals favorable to gold. Data sources: Bloomberg, Haver, Wind, CICC Research Department.
Whether the expansion of US debt and fiscal deficits or central banks’ accelerated gold purchases have limited indicative significance for the top of the gold bull market.
Chart: Central bank gold purchase volume forecasts the top of the bull market with moderate accuracy.
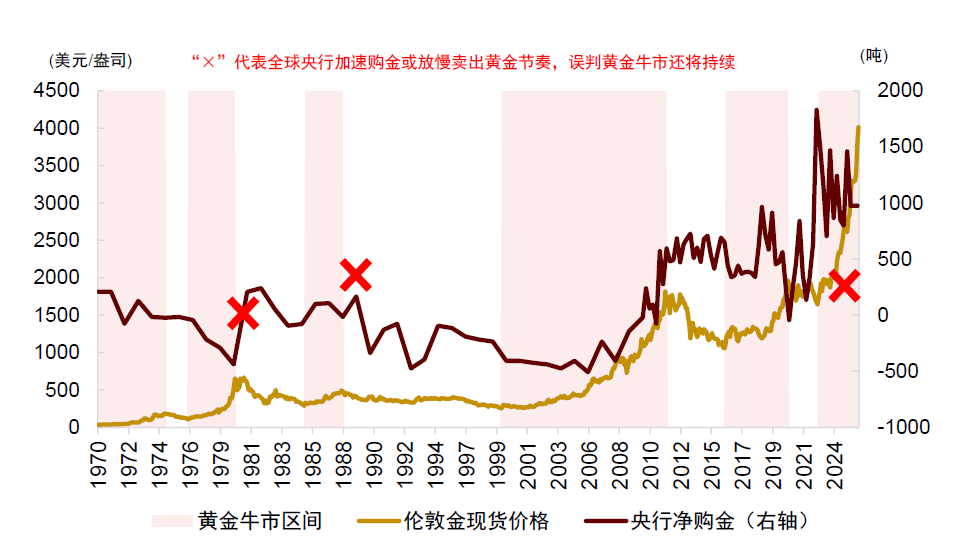
Data sources: Bloomberg, Haver, CICC Research Department.
Chart: The US fiscal deficit rate has long-term explanatory power for gold prices but does not accurately predict the timing of gold market tops.
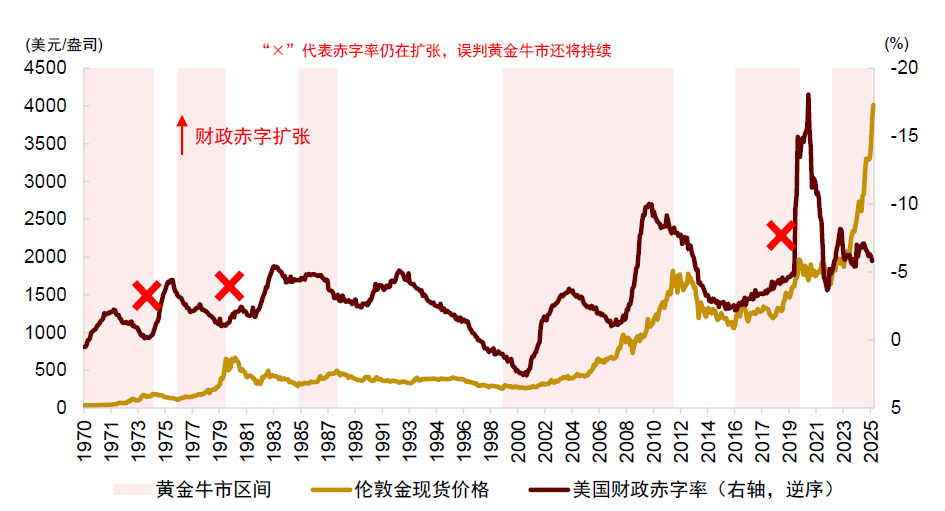
Note: Red '×' marks indicate an expansion in the deficit rate incorrectly predicting the continuation of the gold bull market.
Data Source: Bloomberg, Haver, CICC Research Department
The Federal Reserve remains in an easing cycle, with the U.S. economy still plagued by stagflation (declining growth and rising inflation). Therefore, until there is evidence of a turning point in U.S. policy and the economy, the gold bull market may continue, and we maintain our overweight position in gold.
How much further can gold rise?
In early 2024, the gold price rose from its low of $1,640 per ounce in October 2022 to near $2,000 per ounce. The market has shown significantly increased divergence in gold valuation assessments. However, we firmly believe that gold is not overvalued. We argue that the traditional pricing framework is becoming obsolete and have introduced, for the first time, a four-factor model (real interest rates, the U.S. dollar, central bank gold purchases, and U.S. debt levels) to systematically explain and forecast gold prices, proposing a price midpoint of $2,400 per ounce for gold.
In January 2025, we upgraded to Gold Model 2.0 and raised our long-term gold price forecast to $3,300-$5,000 per ounce.
Gold has now risen to around $4,500 per ounce, already reaching our long-term price forecast ahead of schedule. Based on current fundamental indicator values, the gold price has already significantly exceeded the short-term valuation midpoint calculated by our model, indicating the possible presence of a bubble.
Chart: Gold price has significantly exceeded the valuation midpoint calculated by the model

Data Source: Wind, CICC Research Department
Based on the above discussion, as there has been no turning point in Federal Reserve policy or the U.S. economy, the gold bull market may not yet be over. However, after gold prices have deviated from fundamental indicators and model fits, market volatility may increase significantly, making specific price level predictions more challenging. We recommend de-emphasizing precise gold price forecasts and focusing more on timing changes in asset trends. We expect that by early 2026, due to persistently rising U.S. inflation and marginal improvement in growth, the Federal Reserve may slow the pace of easing, potentially creating temporary downward pressure on gold performance. Looking further ahead, with the inauguration of a new Federal Reserve Chair in May 2026 and a downward inflection point for U.S. inflation expected in the second half of 2026, the Fed may accelerate rate cuts again, providing new support for further gold price increases. Thus, the future gold bull market may not follow a one-way trend but will fluctuate based on shifts in Federal Reserve policy and the U.S. economic outlook.
The same logic applies to commodities such as silver. Due to silver's smaller market size and relatively lower liquidity, its price volatility may exceed that of gold.
Asset allocation recommendations: Maintain an overweight position in gold, capitalize on short-term trading opportunities and liquidity spillover effects, upgrade commodities to neutral weight, maintain an overweight position in Chinese equities, underweight Chinese bonds, and maintain a neutral weight in U.S. equities and bonds.
Gold has risen significantly this year, leading to relatively high valuations. The phased withdrawal of the Federal Reserve's easing expectations in early 2026 may become a source of risk. Considering that the Fed will eventually accelerate easing again next year, a significant pullback in gold prices early next year could present an opportunity to increase allocation at a lower level. Following the substantial rise in gold, commodities such as copper and silver have also shown strong performance, partly reflecting the spillover effect of gold liquidity. In addition, commodities can hedge against geopolitical risks and the risk of overheating in the U.S. economy. We have alreadyAnnual Outlookrecommended upgrading commodities to standard allocation, with particular optimism toward non-ferrous metals. Meanwhile, we note that metals like silver have smaller market sizes compared to gold and lower liquidity. If gold becomes volatile next year, the risk of a pullback will be greater. Therefore, we advise implementing risk controls and avoiding blindly chasing gains.
Chinese equities continue to benefit from the wave of AI technology and ample liquidity. Current valuations are reasonable, and no signals indicating a market peak have emerged. Hence, we remain firmly optimistic about the revaluation of Chinese assets and maintain an overweight position in Chinese stocks. In terms of style, due to relatively moderate pro-growth policies, the market may still favor technology growth in the short term. A shift to cyclical or value styles will require clearer economic or policy signals.
Chinese bond yields are already at relatively low levels, with relatively high valuations. Market capacity for long-term bond supply is limited, increasing the likelihood of further steepening of the yield curve. We recommend maintaining an underweight position in Chinese bonds.
Chart: Over the past two years, the decline in bond yields has outpaced economic fundamentals, resulting in expensive bond valuations and potential adjustment risks.
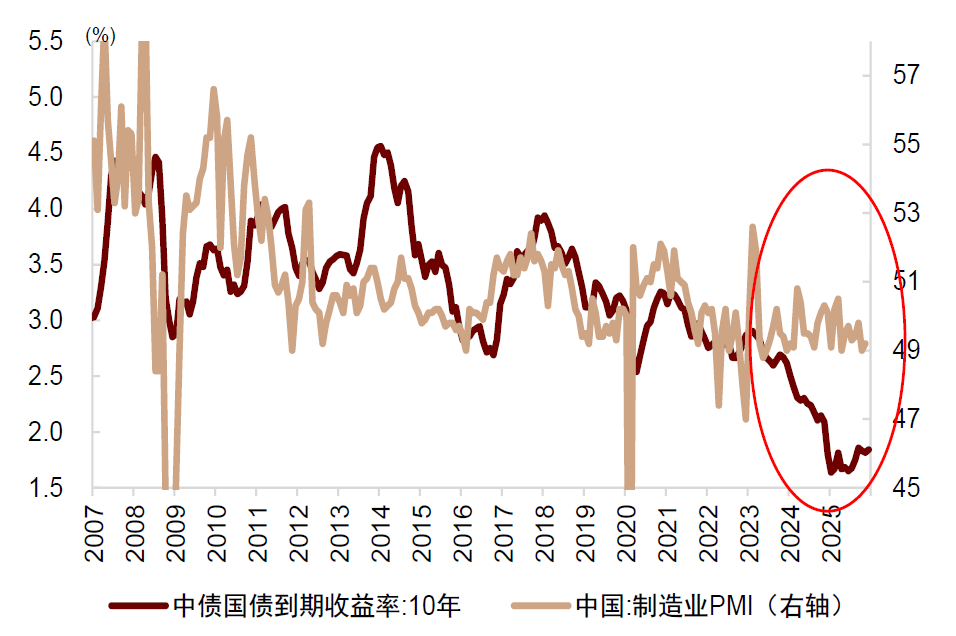
Data Source: Wind, CICC Research Department
Regarding overseas assets, U.S. equities also benefit from macro liquidity and AI industry trends. However, their elasticity during the dollar depreciation cycle is low, compounded by concerns over high valuations, posing significant risks for chasing gains. We recommend maintaining a standard allocation for U.S. equities.
Chart: During each period of dollar decline, non-U.S. equities have outperformed U.S. equities.
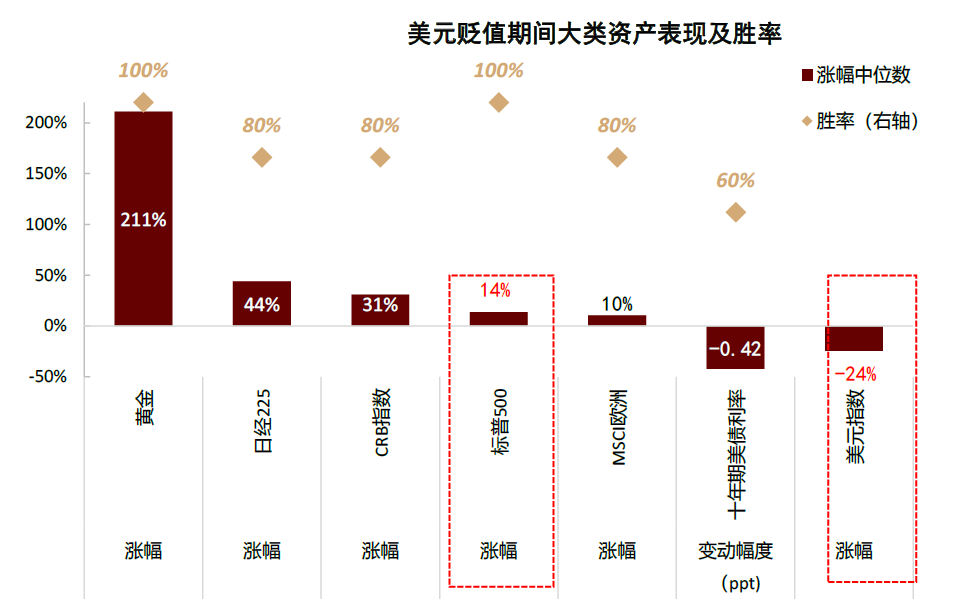
Data Source: Haver, CICC Research Department
At the same time, it is important to note that if U.S. economic growth and inflation stage a temporary rebound in the first quarter of next year, there may be a possibility of a shift between growth and value styles. For U.S. Treasuries, inflationary pressures and the retreat of easing expectations early next year could create volatility. Following the implementation of the "Inflation Reduction Act" at the beginning of the year, U.S. fiscal debt issuance has increased. If the "reciprocal tariffs" are overturned by the Supreme Court, there may be risks of temporarily issuing more U.S. Treasuries to raise funds, which could negatively impact U.S. Treasury performance. Thus, we suggest maintaining a standard allocation for U.S. Treasuries in the short term.
From a medium-term perspective, the market currently only expects the Federal Reserve to cut interest rates twice in 2026, which we believe is overly conservative. The new Federal Reserve Chair will take office in May next year, and U.S. inflation may enter a downward cycle in the second half of the year, providing the Fed with the conditions to cut interest rates more than twice. The 10-year Treasury yield may also fall to around 3.5%. We recommend patiently waiting for the appropriate timing to increase allocation to U.S. Treasuries.
Chart: Futures market expects the Federal Reserve to cut interest rates only twice in 2026
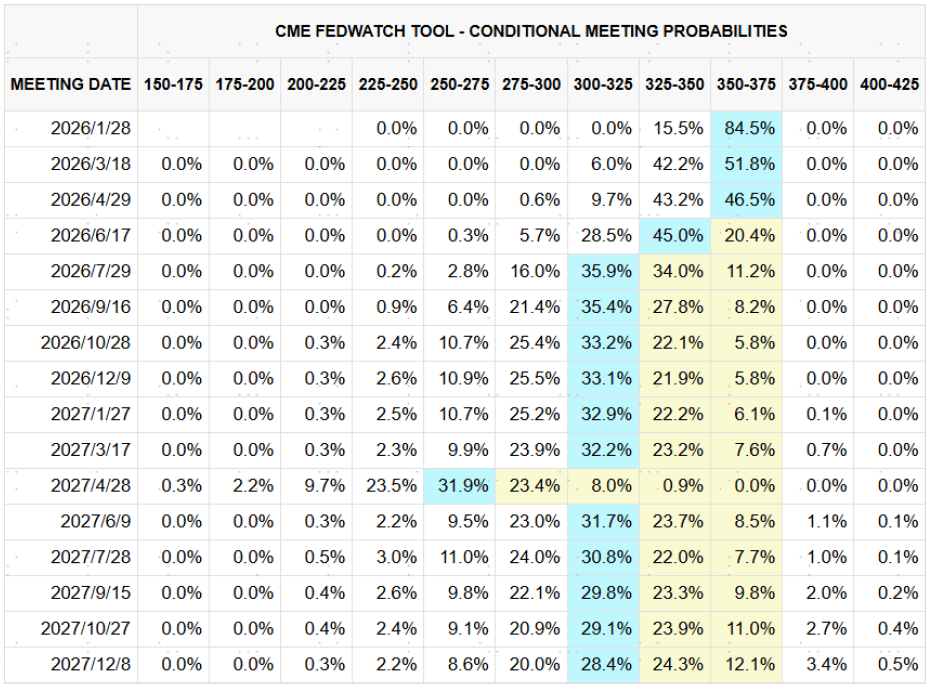
Source: CME Group, CICC Research Department
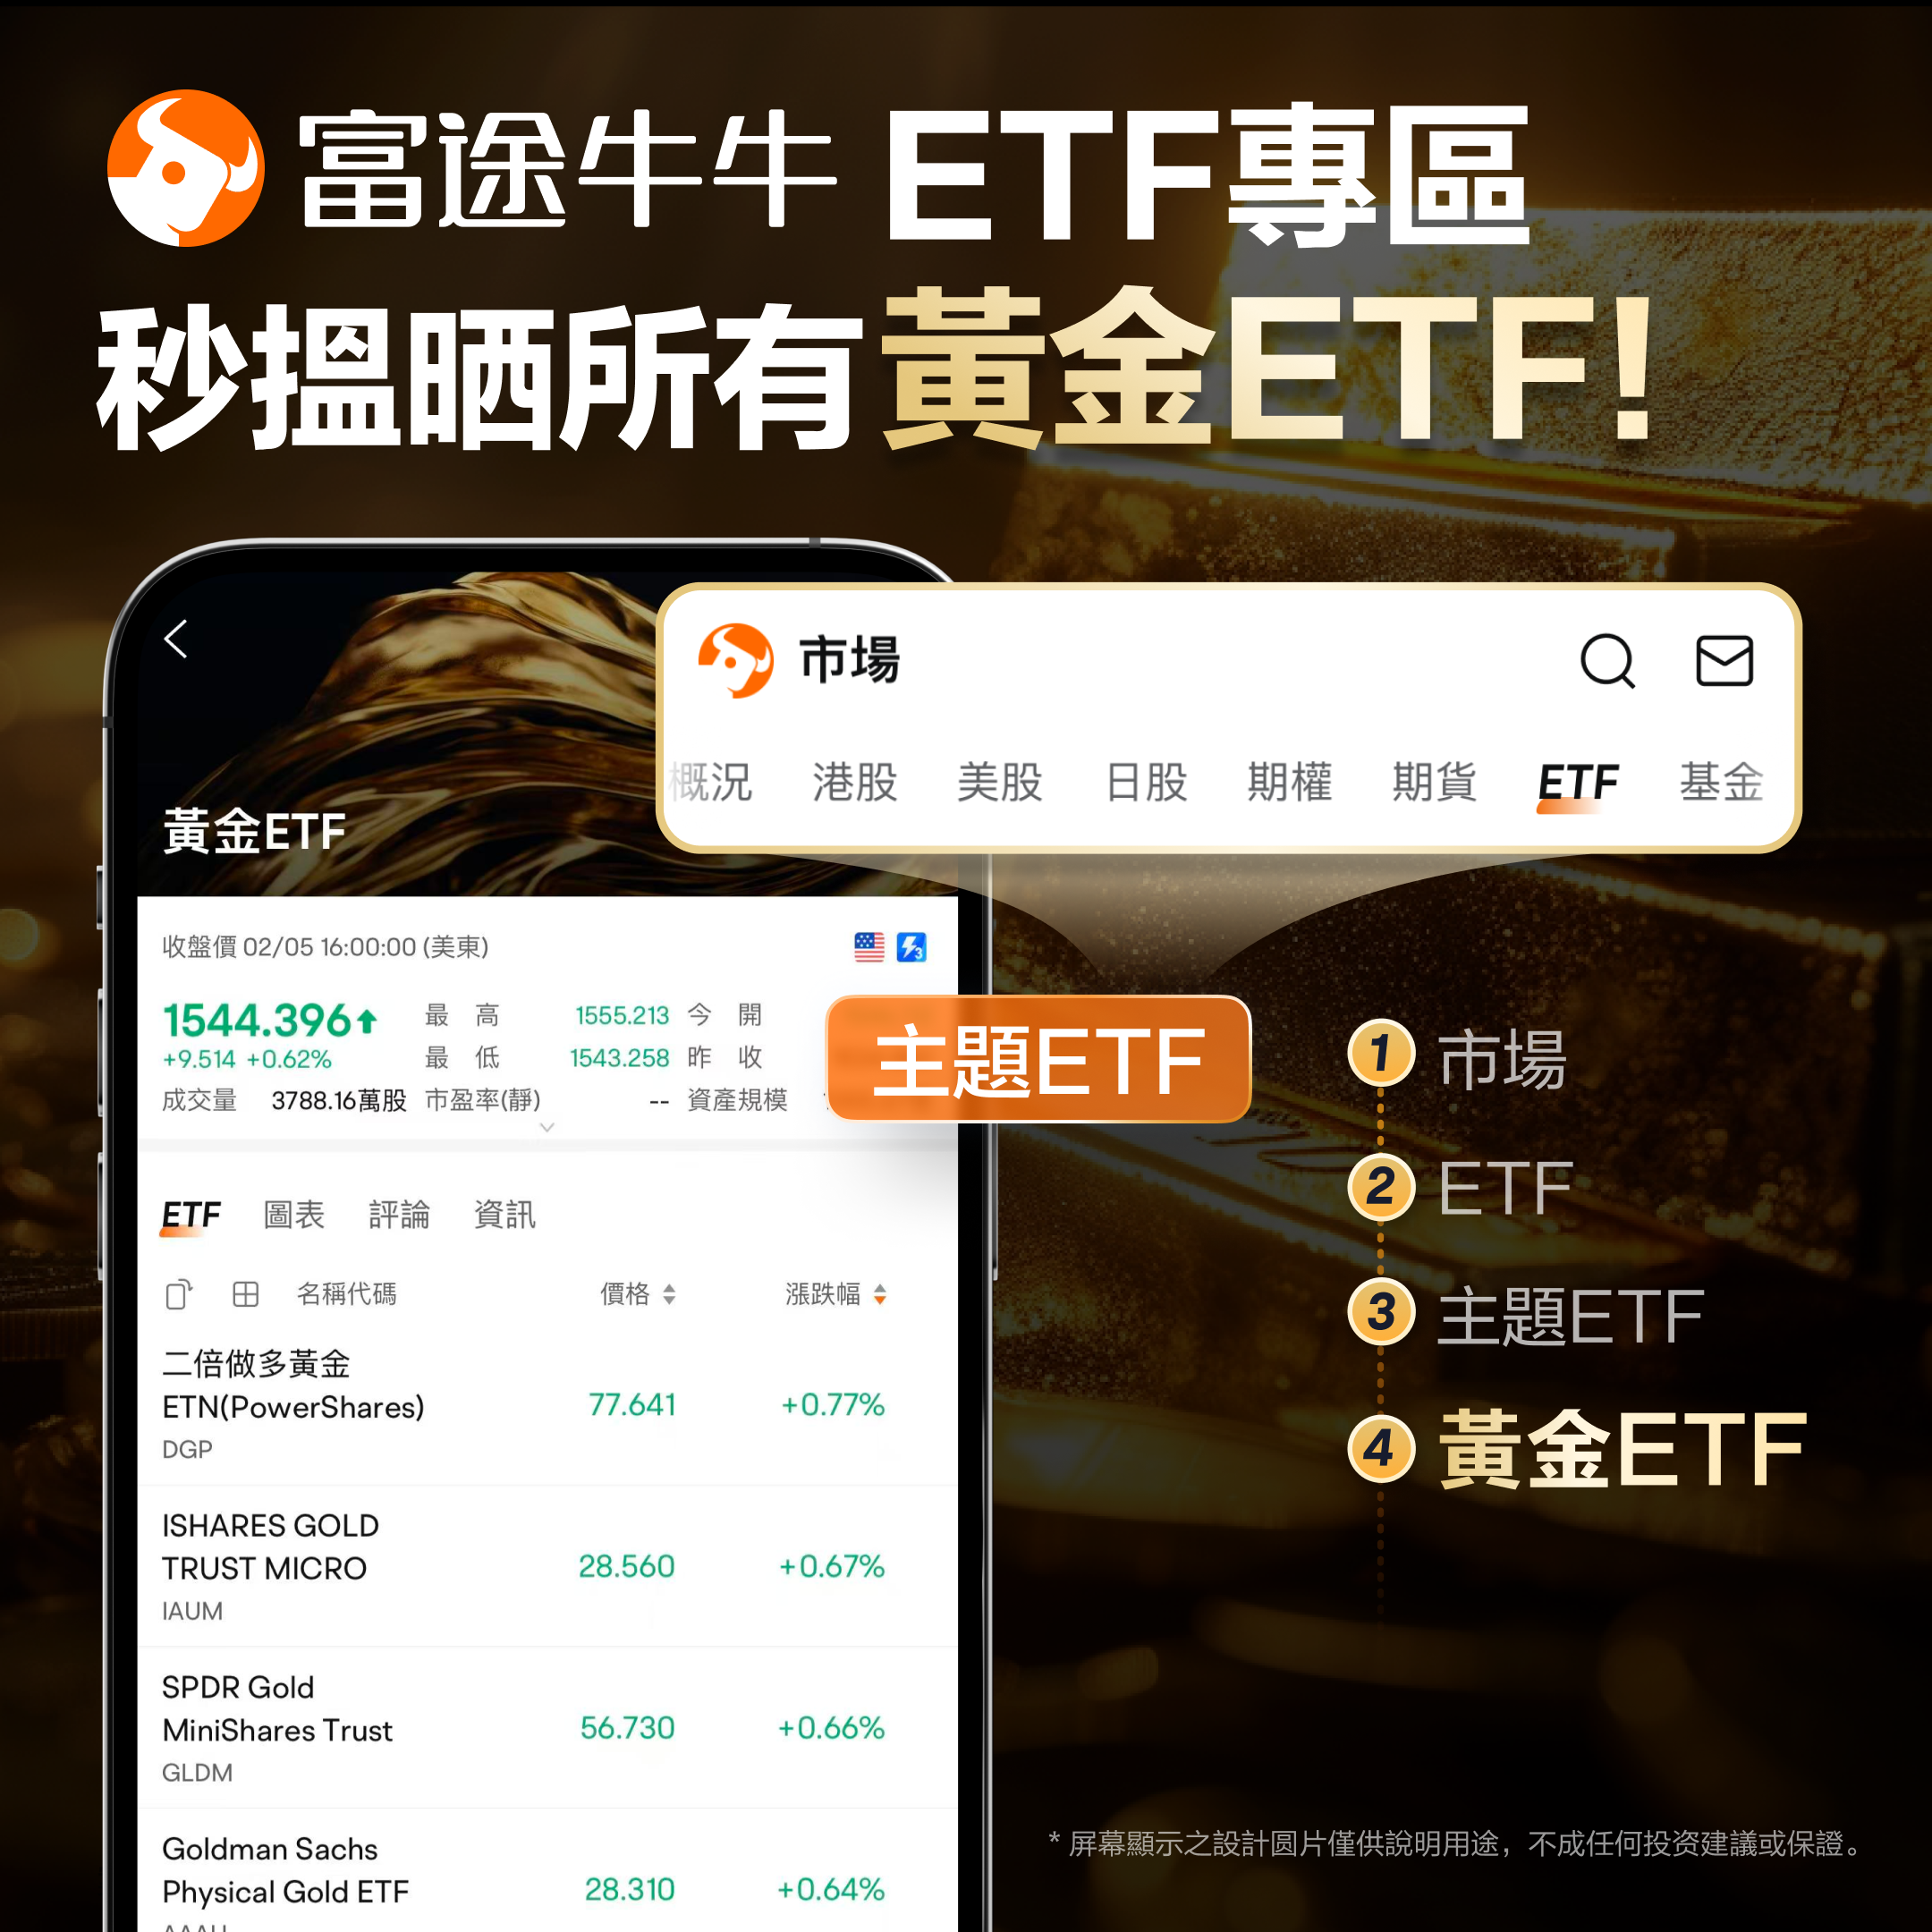
 How to quickly invest in gold? Visit the Futubull ETF section for direct access to all gold ETFs!
Open Futubull > Market > ETF > Thematic ETF > Gold ETF, and choose from all available gold ETFs!
Editor/KOKO