
A turning point that has only occurred three times in 130 years has arrived again, with the Dow-to-Gold ratio breaking a 45-year long-term trend. Scenarios of deflation, stagflation, and inflation all indicate that gold will outperform the US stock market. This cycle has been brewing for a long time, and the magnitude of the market movement may exceed historical averages.
Gold investors should take note: the fourth major turning point in the Dow-to-Gold ratio has arrived. This rare, powerful, and cautionary signal has only occurred three times in the past 130 years, and now it has re-emerged.
This signal indicates that $XAU/USD (XAUUSD.CFD)$ a multi-year upward trend is forthcoming, while holders of industrial stocks such as those in the Dow Jones Industrial Average and S&P 500 may face prolonged losses spanning several years.
 The significance of this signal cannot be overstated, as it will serve as a critical decision-making tool for precious metals investors in the coming years.
What is the Dow-to-Gold ratio?
The Dow-to-Gold ratio refers to the number of ounces of gold required to purchase one share of each of the 30 component stocks in the Dow Jones Industrial Average.
The Dow Jones Industrial Average was created in 1896 by Charles Dow and Edward Jones as a measure of the performance of the U.S. economy.
The history of gold dates back to ancient times, with at least five millennia during which it has been used as a store of wealth, and likely even longer for ceremonial purposes.
In short, the Dow-to-Gold ratio provides a clear indication of whether industrial stocks or gold, as an age-old reserve of wealth, is appreciating faster as a core asset.
Historical Evolution of the Dow-to-Gold Ratio
The chart below illustrates the trajectory of this ratio since its inception, highlighting the four major inflection points that have occurred over the past 130 years.

First, review the key turning points of the previous three Dow-to-gold ratios to analyze the underlying signals behind this fourth turning point.
First turning point: 1930–1933
The Federal Reserve was established in 1913, and after World War I, the United States experienced an economic boom. Multiple favorable factors combined to create a perfect environment for industrial growth: the newly formed central bank released low-cost funds, and the post-war peace framework propelled robust economic development.
The period now known as the 'Roaring Twenties' was fundamentally the result of a continuously improving economic foundation, coupled with the Federal Reserve’s ability to independently inject newly issued currency into the U.S. market.
In 1921, the Dow-to-gold ratio was 3.0, and by 1929 it had climbed to a peak of 18.6. During this period, the Dow's increase was 6.2 times that of gold. This data not only reflected the real economic growth of the United States but also demonstrated the speculative frenzy fueled by the Fed's monetary stimulus.
However, no trend can continue indefinitely. In 1929, with high stock valuations and rampant speculation, the stock market reached its peak and then began a prolonged decline lasting four years.
Ultimately, between 1929 and the lows of 1933, the value of the Dow relative to gold plummeted by 90%, wiping out all gains from the 1920s. During the same period, gold not only maintained its value but also appreciated officially due to the Gold Reserve Act of 1933 — the price of gold rose from $20 per ounce to $35, a 75% increase.
In summary, by 1933, gold holders could purchase ten times the amount of industrial stocks compared to 1929. In just four years, the wealth of gold holders relatively increased tenfold, which is the market dividend brought about by the first turning point of the Dow-to-gold ratio.
Second turning point: 1968–1980
The second turning point of the Dow-to-gold ratio occurred during the economic recovery phase following the Great Depression and World War II. The ratio climbed from 1.9 at the beginning of the Great Depression in 1933 to a peak of 24.5 in 1966. Over these 33 years, the Dow's increase was 12.9 times that of gold, marking a new era globally characterized by the advent of the computer age, commercial aviation, and space exploration.
However, at the same time, two unwinnable wars—the Korean War and the Vietnam War—caused a substantial increase in U.S. debt, plunging the country into an unsustainable 'guns and butter' model: waging multiple overseas conflicts while continuously ramping up domestic social welfare spending.
Some argue that a nation can either focus on external expansion or prioritize investment in people's livelihoods, but it cannot sustain both over the long term.
What were the consequences for the United States of its insistence on pursuing both paths simultaneously during the 1960s and 1970s?
After the Dow-to-Gold ratio peaked at 24.5 in 1966, America’s foreign creditors began to question the sustainability of its debt levels.
The U.S. was subsequently forced to abandon the gold standard for the dollar established during the Great Depression. By 1971, the dollar had become a pure fiat currency, and gold began trading freely in the U.S. for the first time.
Between 1971 and 1980, the price of gold surged 24-fold, rising from $35 to $850, while the Dow Jones Industrial Average (Dow) remained weak during this period, experiencing multiple deep corrections of 40%–60%.
Ultimately, the Dow-to-Gold ratio fell from 24.5 in 1966 to 1.0 at gold’s peak in 1980, with both the January 1980 level of the Dow and the price of gold reaching a nominal value of 850.
This means that over 14 years, the relative value of the Dow compared to gold shrank by more than 95%.
In other words, by 1980, gold holders could purchase 20 times as many Dow components as they could in 1971. Over nine years, the real wealth of gold holders relatively appreciated 20-fold, showcasing the immense power embedded in the inflection point of the Dow-to-Gold ratio.
The Third Inflection Point: 2002–2011
During the 1980s to 1990s, the rise of personal computers, mobile phones, and the internet boom drove the Dow-to-gold ratio from 1.0 to a peak of 45.0 in August 1999, with the Dow appreciating 45 times more than gold over just two decades.
However, the speculative frenzy fueled by the internet bubble of 1999 could not be sustained in the long term. Gold, which had been considered an 'outdated asset' since peaking in 1980, saw its price drop from $850 to $250 by 1999, marking the beginning of the third turning point for the Dow-to-gold ratio.
The first decade of the 21st century was marked by turbulence: the September 11 attacks on the World Trade Center, simultaneous wars in Afghanistan and Iraq, and the global financial crisis from 2007 to 2009. During this period, the Federal Reserve and central banks around the world printed money primarily to bail out 'too big to fail' multinational financial institutions, while also funding two unwinnable wars in the Middle East.
What were the consequences of the third turning point?
During the global financial crisis, the Dow plummeted nearly 60%, while the price of gold surged from $250 to surpass the $1,900 mark in 2011.
The Dow-to-gold ratio fell from 45.0 in 1999 to 5.7 in 2011, representing an 87% decline in relative value for Dow holders. By 2011, gold holders could purchase 7.9 times more Dow stocks compared to a decade earlier.
The early 21st century witnessed a transfer of wealth from industrial stockholders to gold holders.
Fourth Turning Point: From 2025 to the present, to be continued.
Over the past 130 years, the fourth turning point of the Dow-to-gold ratio has officially arrived. It is crucial to reiterate the significance of the chart mentioned above, as the signals it conveys cannot be ignored.
Following the peak of precious metal prices in 2011, speculation in artificial intelligence and cryptocurrencies dominated investment trends for the next decade, while gold was neglected for over ten years, with its price consolidating below the 2011 high until 2024.
In 2018, the Dow-to-Gold ratio climbed from 5.7 in 2011 to a peak of 22.5, with the growth rate of industrial economy nearly quadrupling that of gold.
However, gold has not been forgotten for long, as the intensifying debt issues in the U.S. and globally caused the price of gold to surge suddenly in March 2024. Over the past two years, its price has more than doubled. As of December 2025 at the time of writing this article, gold prices are hovering above $4,500 per ounce.
Most importantly: the fourth inflection point of the Dow-to-Gold ratio has now been officially confirmed.
The chart clearly shows that the blue trend line starting from 1980 has been broken (the red-marked area indicates the fourth inflection point).
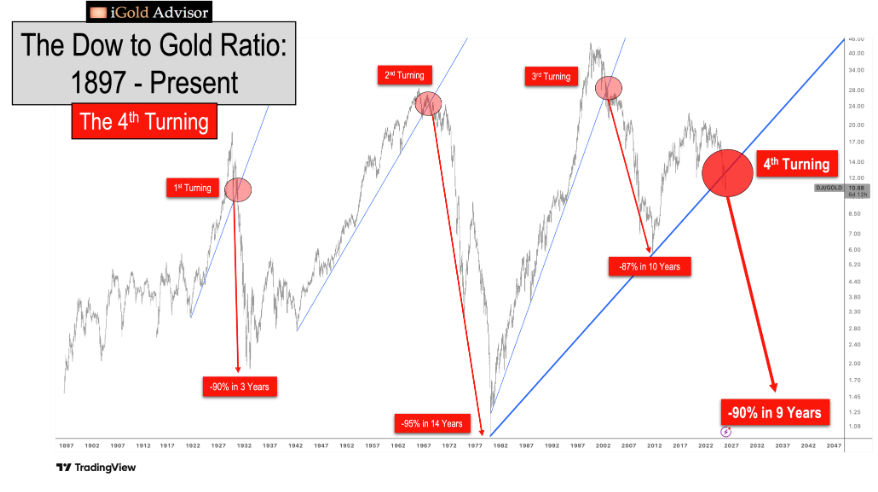
In the historical trend of the Dow-to-Gold ratio, this signal has only appeared three times before: the first inflection point in 1930, followed by a 90% plunge in the Dow relative to gold over the next four years; the second inflection point in 1968, followed by a 95% drop in the Dow relative to gold over the subsequent 14 years; and the third inflection point in 2002, followed by an 87% decline in the Dow relative to gold over the next decade.
Taking the average of the previous three inflection points, the Dow is projected to decline by 90.5% relative to gold over a span of 9.3 years.
Based on the recent peak of 22.5 in 2018, a 90.5% decline implies that the Dow-to-Gold ratio will fall to 2.1 by January 2028.
Currently, the ratio stands at 10.9, suggesting that the downward trend of the Dow relative to gold will likely continue in the coming years, with an expected decline of more than 80%.
The aforementioned data serves merely as an average reference. The projection that the gold ratio will fall to 2.1 by January 2028, accompanied by an additional 80% drop in the Dow relative to gold, is based solely on the average of the previous three cycles.
There is a well-known adage in technical analysis: The longer a trend persists, the more significant the implications of its breakout.
In this cycle, the Dow-to-gold ratio has just completed a trend breakout that lasted 45 years, far surpassing any previous cycles: the first turning point in 1930 only broke a 9-year trend; the second turning point in 1966 broke a 24-year trend; and the third turning point in 2002 broke a 22-year trend.
The average duration of the previous three trend breakouts was 18.3 years, while the trend breakout duration for this fourth turning point reached 45 years, nearly 2.5 times the previous average.
This implies that the fourth turning point in the Dow-to-gold ratio could become the most critical trend breakout in their historical trajectory, with the Dow potentially falling relative to gold by more than the average of the previous three cycles.
Dow and Gold Target Projections
If we conservatively estimate based on the average value, the ratio is projected to decline by 80% over the next few years, returning to a level of 2.1.
It should be noted that this 80% decline refers to the Dow’s fall relative to gold. With the current Dow at 48,700 points and the price of gold at 4,500 USD per ounce, this relative decline can be achieved through the following three scenarios:
Deflationary Collapse Scenario
Dow: 48,700 points → 9,740 points (an 80% crash) Gold: 4,500 USD per ounce → 4,500 USD per ounce (unchanged). In this scenario, the price of gold remains stable, while the Dow experiences an absolute plunge of 80%.
Stagflation Scenario
Dow: 48,700 points → 21,000 points (a 57% drop) Gold: 4,500 USD per ounce → 10,000 USD per ounce (a 122% increase). In this scenario, the price of gold rises by more than double, while the Dow falls by over 50%, ultimately resulting in an 80% decline in the Dow-to-gold ratio.
Inflation Scenario
Dow Jones Index: 48,700 points → 73,000 points (up 50%); Gold: $4,500/ounce → $34,700/ounce (up 670%). In this scenario, inflation drives the Dow Jones Index up by 50%, while gold surges 670% to $34,700/ounce. The Dow-to-Gold ratio still declines by 80%.
Across the three scenarios mentioned above, the change in purchasing power of the Dow Jones Index relative to gold is consistent: the Dow Jones Index falls 80% relative to gold, or gold rises fivefold relative to the Dow Jones Index.
It is important to reiterate that these scenarios are based on the average extrapolation of the previous three turning points. However, the duration of the trend leading to the fourth turning point is more than twice as long as the previous average, indicating that in the coming years, this ratio may drop significantly below 2.1, and gold is expected to experience an even larger increase.
Core Conclusion of the Dow-to-Gold Ratio
The fourth turning point of the Dow-to-Gold ratio has been established and is clearly visible in the price chart. Price movements reflect all information available to market participants, signaling that, in the medium term, the severity of global debt issues has surpassed the growth potential of economies.
Data indicates that in the coming years, the Dow Jones Index will decline by at least 80% relative to gold, or gold will rise by at least fivefold relative to the Dow Jones Index, with both outcomes resulting in identical changes in purchasing power.
The market's signal is clear: despite continuous breakthroughs in artificial intelligence, pharmaceuticals, space exploration, and nanotechnology, the debt problem in the United States and globally will remain the core issue in the short term. Only when the debt problem is resolved can humanity’s development pace, supported by technological advancements, be expected to accelerate further.
As seen in the 1970s: breakthroughs were achieved in personal computing, pharmaceuticals, and space exploration, yet the debt problem became the pressing core issue. In the coming years, technological progress will continue, but gold is highly likely to outperform the Dow Jones Index significantly.
The accumulated global debt problem is severe and must be prioritized for resolution—this is the core signal being transmitted by the market.
In the era of fiat currency, governments often resort to printing money out of thin air in an attempt to mask debt crises. This behavior leads to the devaluation of their domestic currencies, while gold, as an ancient store of wealth beyond the subjective control of politicians and central banks, will see a corresponding rise in price.
Ultimately, the fourth turning point in the Dow-to-Gold ratio will fully materialize.
This is not theoretical speculation but rather a real trend currently unfolding in price charts.
Current Investment Strategy
From now until the conclusion of the fourth turning point phase, investors should overweight precious metals, as well as gold and silver mining stocks.
In the coming years, investors who precisely allocate capital to precious metals will encounter a generational opportunity for wealth transfer.
In the next cycle, there will be an excellent opportunity to position into industrial company stocks—but this will require waiting until the Dow components’ valuation relative to gold declines by at least 80%.
"A single correct decision in life can fundamentally alter one’s destiny." The era of gold has now arrived.
The content of this article is provided by Christopher Aaron, Chief Analyst and Founder of iGold Advisor.
Editor/Doris