
The price trends of global commodity markets in 2025 showed evident divergence.
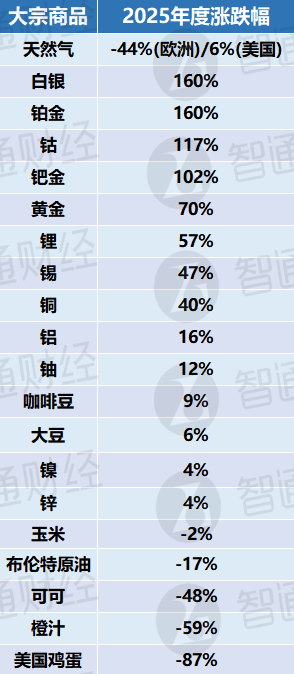
The price trends of global commodity markets in 2025 show a clear divergence. The main characteristics are the decline in energy and agricultural product prices, while the prices of precious metals (such as gold and silver) and industrial metals (such as copper) continue to rise and repeatedly reach new highs. This situation is mainly influenced by a combination of factors including changes in global demand, geopolitical tensions, adjustments in monetary policy, and the development of the new energy industry. This divergence is expected to continue until 2026, with energy prices forecasted to fall further due to an oil supply surplus, while precious metal prices will continue to rise.
a main energy production area. Beijing, Shanghai, Guangzhou, and Shenzhen will be like the United States, consumer markets.
Crude oil
2025 Review: The global crude oil market in 2025 exhibited a volatile trend of 'initial rise followed by decline, with a downward shift in focus,' with Brent crude prices ultimately settling in the range of $60-70 per barrel. In the first half of the year, geopolitical friction and policy shifts were the core drivers of oil price volatility. At the beginning of the year, heightened U.S. sanctions on Russia's energy sector fueled risk aversion, pushing Brent prices to a peak of $83. Subsequently, the market fluctuated between expectations of Trump administration policies favoring increased drilling and tough sanctions on Venezuela and Iran. In the second quarter, concerns over global demand contraction triggered by 'comprehensive trade tariffs' and threats to energy channels from escalating tensions in the Strait of Hormuz caused oil prices to experience sharp declines, rebounds, and eventual retreats. During this period, repeated shifts in geopolitical premiums constituted the main theme of the market.
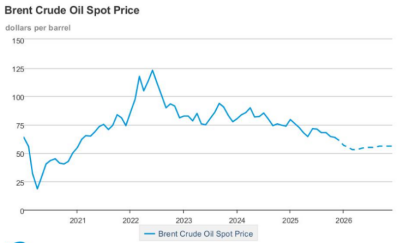
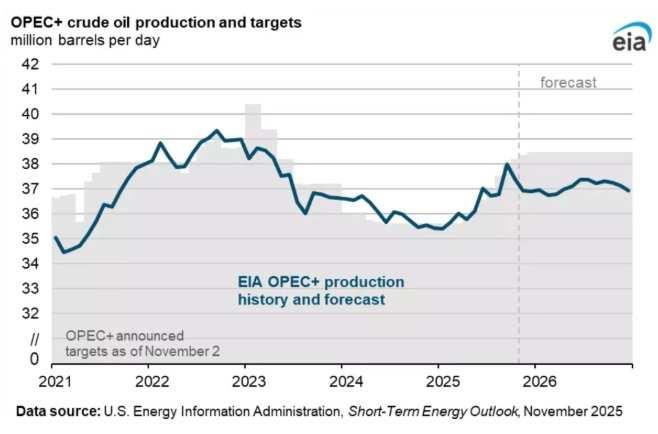
 In the second half of the year, the logic of the crude oil market shifted from 'geopolitical drivers' to 'strong supply and weak demand,' initiating a sustained downward trajectory for oil prices. On the supply side, OPEC+ adjusted its strategy, shifting from production cuts aimed at maintaining prices to phased increases in output to regain market share. Coupled with record-high U.S. crude production, this led to rapid accumulation of global inventories. On the demand side, sluggish growth in oil consumption was significantly affected by slowing global economic growth, accelerated adoption of electric vehicles, and structural transitions in transportation energy usage, with daily growth shrinking to less than 800,000 barrels. As peace prospects emerged in Ukraine by the end of the year, geopolitical premiums further diminished, and under strong expectations of oversupply, both Brent and WTI prices came under widespread pressure.
2026 Outlook: In 2026, the crude oil market will face even more severe oversupply pressures, and the price center is expected to decline further. 2025 marked a turning point for the crude oil market, while 2026 will be a year of deep adjustment. The market has entered a 'seller-dominated' phase, and as long as the core issue of oversupply remains unresolved, oil prices will remain under continuous pressure. Investors should monitor OPEC+'s policy adjustments in the second quarter of 2026 and potential geopolitical premiums in regions such as the Middle East.
On the supply side, OPEC+ faces a dilemma. Although the alliance announced a suspension of production increases in the first quarter of 2026 and plans to extend the production cut agreement through the end of the year, the accumulated idle capacity from previous years continues to exert significant pressure. Meanwhile, non-OPEC+ countries led by the United States, Brazil, and Guyana have maintained robust production growth. The IEA forecasts that global total supply will increase by approximately 2.4 million barrels per day in 2026.
On the demand side, the weak trend driven by sluggish global economic growth and accelerating energy transition is unlikely to reverse. The IEA projects that demand growth in 2026 will be only about 860,000 barrels per day, leading to an anticipated surplus of 2 to 3.8 million barrels per day. The EIA also warns that overflowing commercial inventories may force oil prices to test periodic lows.
Based on this, authoritative institutions generally hold a bearish outlook for oil prices in 2026. Goldman Sachs and JPMorgan predict that Brent crude average prices will fall to the $56-60 per barrel range, while the EIA is more pessimistic, suggesting prices could drop to $51 in the first quarter. Overall, 2026 will be dominated by 'production competition,' with the Trump administration’s pro-energy production stance and OPEC+'s battle to defend market share jointly suppressing international oil prices, keeping them oscillating and consolidating at lower levels.
Natural Gas
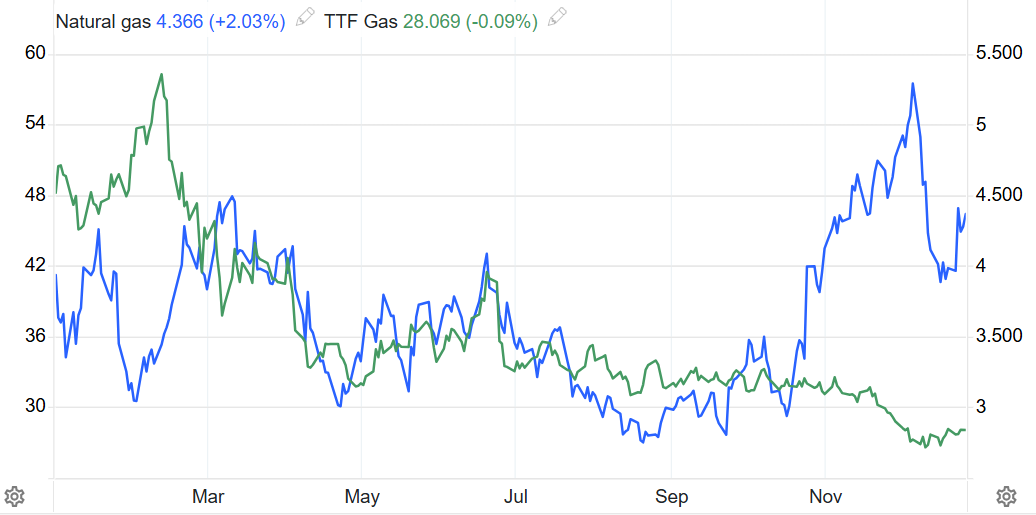
2025 Review: The global natural gas market in 2025 exhibited characteristics of 'early highs followed by lows and divergent trends in Europe and the U.S.' Following a sluggish 2024, prices in Europe, the U.S., and Asia surged in the first half of the year due to unexpectedly low temperatures early in the year and reduced Russian gas flows following the expiration of the Ukraine transit agreement, with Henry Hub prices briefly reaching $4.5. However, with the release of new capacities like Plaquemines in the U.S. and slower demand growth in Asia due to energy structure adjustments, global supply bottlenecks were significantly alleviated. Market focus quickly shifted from supply tightness to 'seasonal surplus,' driving rapid inventory accumulation and sending global gas prices into a downward channel.
In the fourth quarter, the market evolved into dramatic and divergent trends. In the U.S., heating demand surged due to La Niña and Arctic cold fronts, causing natural gas prices to spike to a three-year high of $5 in early December, showing extreme strength. Meanwhile, European markets experienced relentless declines in TTF prices due to diversified supply channels, persistently weak industrial demand, and easing geopolitical tensions.
Outlook for 2026: The global natural gas market is set to experience a pivotal shift from 'tight balance' to 'phased surplus' in 2026. The concentrated release of new capacities from the United States, Qatar, and Canada is expected to drive a 7% surge in global LNG production capacity, marking the largest increase since 2019. Despite ample supply, total demand worldwide will steadily grow by 2%, driven by rigid electricity consumption due to AI data center construction and rebounding demand in Asian emerging markets as gas prices moderate. This supply-demand dynamic provides strong bottom support for gas prices, while geopolitical tensions and extreme weather remain critical variables impacting the market.
The U.S. market, propelled by the concentrated commissioning of LNG export terminals and rising electricity demand from AI data centers, has an optimistic price outlook. Goldman Sachs and Morgan Stanley forecast average prices to rise to $4.5-$5/MMBtu. However, the global liquefied natural gas market faces its largest overcapacity risk in years due to surging supplies from the U.S. and Qatar. Analysts warn that with supply growth (10%) far outpacing demand growth (2%), the market may need to lower prices to stimulate consumption in price-sensitive regions like South Asia. Benchmark prices in Europe and Asia (TTF/JKM) could decline significantly.
Uranium
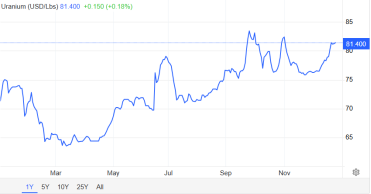
Review of 2025: The uranium market underwent a transformation from 'deflating bubbles' to 'structural support,' with prices exhibiting a pronounced 'U-shaped' recovery. In the first half of the year, speculative capital outflows and macroeconomic pressures drove spot prices to a yearly low of approximately $63/lb by mid-March, fully absorbing the overheated surge to $100/lb seen in 2024. However, in the second half, the resumption of Sprott Physical Fund purchases, renewed nuclear power tenders, and substantial demand driven by AI data centers pushed prices to steadily rebound, breaking through $83/lb in September and stabilizing between $81-$83/lb by year-end.
Notably, the supply-demand structure this year further highlighted the contradiction between 'supply fragility and surging demand.' On the supply side, production disruptions in Kazakhstan and bottlenecks in Western mine expansions persisted. On the demand side, tech giants deepened their involvement in nuclear energy through power purchase agreements, and the global restructuring of supply chains to reduce reliance on Russia increased utilities’ willingness to lock in long-term contracts. Despite volatile spot prices, long-term contract prices remained firm above $80/lb, reflecting deep concerns about potential supply gaps over the next decade. 2025 was not only a consolidation period for uranium prices but also a critical year in which nuclear energy was repriced globally as a core asset for energy security.
Outlook for 2026: Entering 2026, Wall Street investment banks and authoritative institutions have shifted their consensus on uranium prices from 'bottom fluctuation' to 'accelerated upward movement.' Goldman Sachs predicts that spot prices will climb to $91/lb by the end of 2026, with a premium potential of 20%, driven by accelerated global nuclear power construction and reactor life extensions. Bank of America offers a more aggressive forecast, estimating peak prices could reach $135/lb. Industry authorities such as Sprott and the World Nuclear Association (WNA) note that following the completion of inventory drawdowns in 2025, 2026 will see a peak in utility restocking and long-term contract signings, while supply contractions in key producing regions like Kazakhstan will exacerbate shortages. The mainstream view holds that $80/lb has become a solid price floor, and dual drivers of massive electricity demand from AI data centers and supply challenges make uranium prices highly likely to challenge triple-digit levels in 2026, potentially repeating historical explosive growth and becoming the 'new gold' in the energy transition.
Metal
Precious Metals
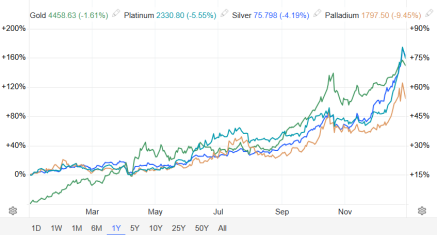
Review of 2025: From an annual performance perspective, precious metals experienced an 'epic rally' this year. Gold surged approximately 70% year-to-date, while silver soared over 160%, both on track for their best annual performance since 1979, extending the robust momentum from 2024. Key factors driving the rally included continued central bank purchases, inflows into exchange-traded funds (ETFs), and three consecutive interest rate cuts by the Federal Reserve during the year. A lower interest rate environment reduced the opportunity cost of holding non-yielding assets, and markets are betting on further rate cuts in 2026. Beyond gold and silver, platinum and palladium also saw wild gains, rising 160% and 100%, respectively.
Moreover, Trump’s hardline stance on reshaping the global trade landscape earlier this year, along with his remarks on the independence of the Federal Reserve, further fueled the precious metals rally. As government debt levels swelled and the attractiveness of sovereign bonds and their issuing currencies declined, investors flocked to so-called 'currency devaluation trades,' providing further support to precious metals demand.
Additionally, the pricing power of silver, platinum, and palladium returned, driven by their industrial attributes. 'Green energy transition' and 'supply chain vulnerability' emerged as the strongest price catalysts beyond financial characteristics. Against the backdrop of five consecutive years of supply deficits and historically low inventories, silver benefited from technological advancements in photovoltaic N-type cell technology and the essential demand for electronic pastes in AI servers, staging a 'physical short squeeze' rally this year with gains leading all precious metals. Platinum benefited from the dual drivers of energy transition and traditional industry. The hydrogen energy sector entered its commercialization year, with electrolyzer demand for platinum transitioning from expectations to physical orders. Meanwhile, delays in petrol car bans and the 'platinum-for-palladium substitution' process, amid production cuts in South African mines, intensified supply-demand imbalances. Although palladium faced long-term pressure from electrification, robust hybrid vehicle demand maintained a baseline. After a sluggish start to the year, geopolitical supply disruptions and large-scale short covering drove a year-end rebound.
2026 Outlook: Wall Street investment banks and authoritative institutions generally believe that the precious metals bull market will enter a new phase of "transition from unilateral general gains to high-level consolidation and value discovery." Leading investment banks such as Goldman Sachs, JPMorgan, and Bank of America unanimously anticipate gold's continued upward trajectory, attributing it to strategic increases in central bank holdings, the Federal Reserve's interest rate cuts, and anxieties over the U.S. dollar’s credibility. The consensus forecast places the average gold price between $4,500 and $4,800 in 2026, with potential to breach the $5,000 mark. The World Bank also noted that although the pace of increase may slow due to higher base levels, physical demand and risk-aversion premiums will provide a solid floor for gold prices.

Silver and platinum group metals are considered the "dark horses" with greater explosive potential in 2026. Institutional consensus suggests that silver, driven by structural supply-demand gaps in photovoltaic and AI sectors, has already priced in some expectations with its surge past $80, and high silver prices might suppress downstream jewelry and electronics industrial demand. Next year, silver prices are expected to remain volatile at elevated levels above $50 per ounce, with an average forecast ranging between $56 and $65 per ounce, reflecting relatively conservative estimates; some aggressive views even project prices as high as $80-$100. Platinum, benefiting from years of supply deficits and materializing hydrogen energy industry orders, is poised for a "once-in-a-decade" catch-up rally, targeting $2,400. In contrast, palladium's outlook is more divided, with institutions like Deutsche Bank cautioning about long-term demand suppression due to electrification progress, suggesting its performance will rely more on geopolitical premiums and supply-side disruptions.
non-ferrous metals.
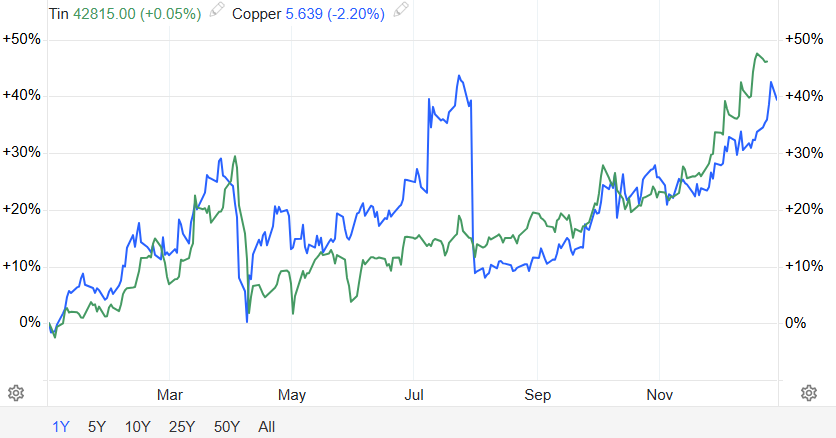
2025 Review: The global industrial metals market exhibited extreme divergence amid the interplay of "new and old growth drivers conversion" and "supply regionalization." Copper and tin led the way into the "computing power and electricity cycle." Copper prices repeatedly hit record highs in 2025, breaching $12,700 per ton at one point. Its core logic shifted from traditional construction to structural demand driven by AI data center expansion and global grid upgrades, compounded by frequent force majeure events in mining regions like Chile and Peru, as well as cross-regional inventory squeezes caused by trade tariffs, making copper the most dominant metal of the year. Tin closely followed the robust recovery of the semiconductor industry, with price levels significantly lifted amid supply uncertainties from Myanmar and Indonesia, showcasing strong upward elasticity.
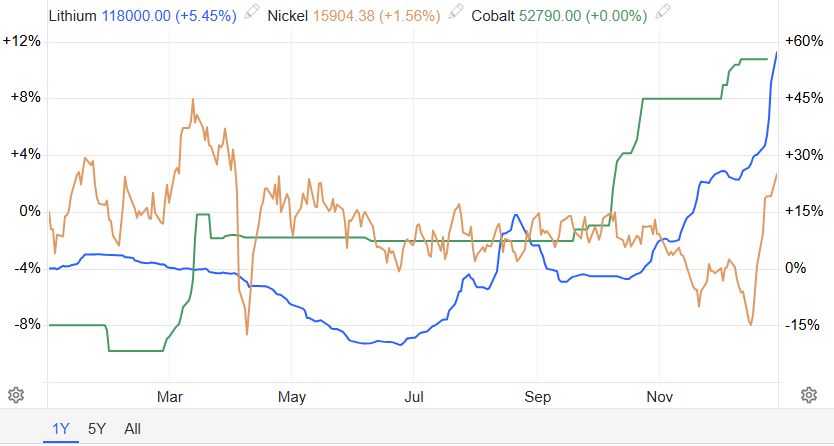
In stark contrast were battery metals for new energy—lithium, cobalt, and nickel—undergoing "deep bottom building" and capacity consolidation. Lithium experienced a brutal cost defense battle in 2025, with lithium carbonate briefly falling below production costs for some mines in the first half, forcing high-cost capacity shutdowns in Australia and Africa. With the recovery of downstream energy storage demand and industry self-discipline against internal competition, lithium carbonate completed a phase of bottom building around 60,000 yuan/ton by mid-year. Nickel remained in surplus throughout the year due to ongoing expansion of high-pressure acid leach (HPAL) capacity in Indonesia, with surging LME inventories capping its rebound. Only towards year-end did Indonesia’s planned production cuts provide a lift. Cobalt emerged from a unidirectional decline, but export quota restrictions from the Democratic Republic of Congo tightened supplies, driving a significant year-end price spike.
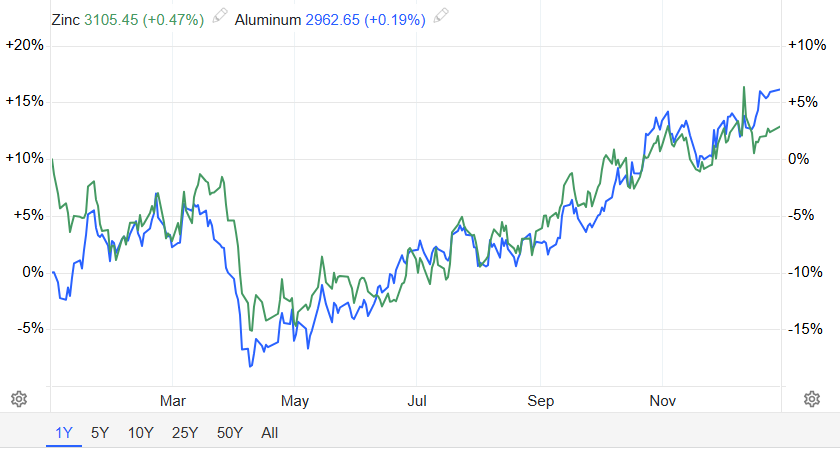
Additionally, aluminum and zinc demonstrated resilience in 2025. These bulk industrial metals oscillated widely at elevated levels amid the interplay of "cost support" and "demand resilience." Aluminum prices were particularly robust, supported by strong AI data center demand, high raw material costs for alumina, and global electrolytic aluminum capacity constraints, maintaining a price range of $2,500-$2,700 per ton. The premium for green low-carbon aluminum significantly widened in 2025. Zinc prices followed a "decline then rise" oscillatory recovery pattern: pressured by tariff impacts and oversupply expectations in the first half, falling to yearly lows, then rebounding in the second half due to reduced smelting output following declining processing fees and bolstered by new energy and infrastructure demand, pushing prices above $3,200 at one point.
2026 Outlook: Entering 2026, Wall Street investment banks and authoritative institutions foresee a complex scenario for industrial metals characterized by "copper and tin outperformance, lithium and nickel recovery, aluminum and zinc divergence." Copper and tin remain institutional favorites. Wall Street predicts copper prices could reach historic highs near $15,000 per ton in the first half of 2026, driven by AI data centers, grid upgrades, and physical shortfalls from U.S. tariffs, before entering a consolidation phase above the $10,000 mark due to profit-taking. Tin prices, benefiting from semiconductor cycle expansion and ongoing supply constraints (Myanmar, Indonesia), are set to approach $44,000 per ton.
New energy metals and base metals face post-destocking revaluation. Bernstein and Deutsche Bank suggest that after clearing excess in 2025, lithium will see supply-demand reversal in 2026, with average lithium carbonate prices expected to recover to $14,000-$18,000 per ton; tighter production policies may offer upside for nickel and cobalt. Morgan Stanley forecasts aluminum reaching $3,250 in Q2 2026, driven by consumption growth from energy transition offsetting potential tariff impacts; while zinc, due to rising supplies, maintains cautious volatility expectations around $2,900-$3,000 by most institutions. Overall, 2026 is a year where industrial metal pricing logic deeply anchors to "resource scarcity" and "electrification necessity."
Agricultural Products
Cocoa and Coffee Beans
2025 Review: After peaking at $12,000 per ton in late 2024, cocoa prices experienced a significant pullback in 2025 but remained structurally elevated. New York cocoa futures hovered around $9,000 at the start of the year but declined steadily as the International Cocoa Organization (ICCO) signaled narrowing supply-demand gaps and recovering production expectations in West African regions (Côte d'Ivoire and Ghana), settling near $6,000 per ton by year-end.
As one of the two most popular crops in 2024, coffee beans exhibited an M-shaped trend of high volatility this year, distinct from the oscillating pullback seen in cocoa. In the first half of the year, prices stabilized briefly as production recovered in Vietnam and Indonesia. However, entering the second half, global benchmark coffee prices, especially for Arabica beans, surged again, hitting record highs in February. Despite a retreat in the latter half due to improved weather conditions after Brazil's heating season, the overall closing price still registered positive annual growth, surpassing 2024 levels.
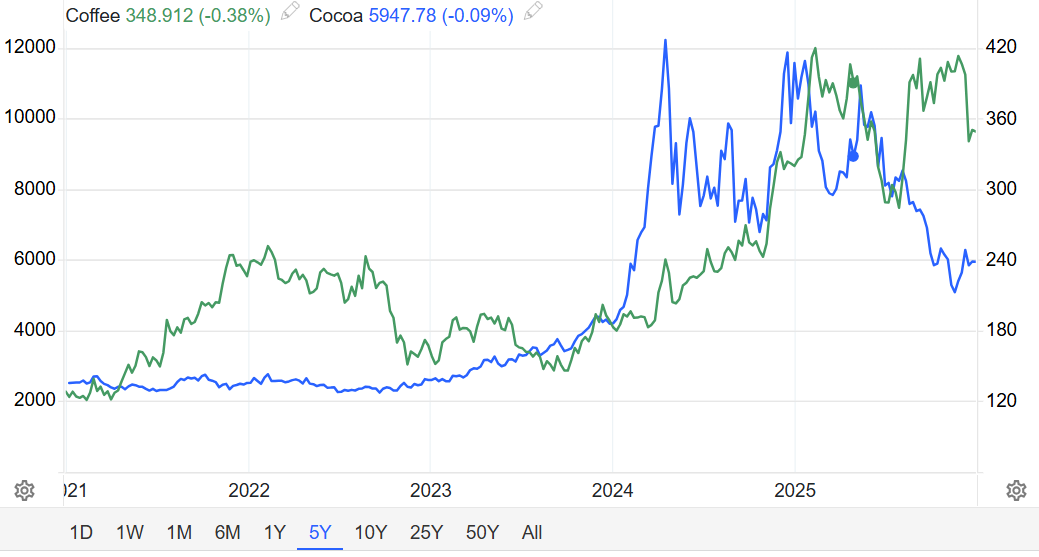
2026 Outlook: According to the latest forecasts by authoritative institutions such as Wall Street investment banks and the World Bank, the global cocoa and coffee markets will move away from extreme volatility and enter a new cycle characterized by 'supply recovery and price decline.' For cocoa, improvements in West African weather conditions and increased production capacity in Latin America are expected to shift the market from a significant deficit to a surplus of about 150,000 tons, driving prices back to a structural equilibrium of around $6,000 per ton. Although high production costs and shrinking industrial demand limit declines, institutions like JPMorgan believe that 2026 will mark a turning point for the chocolate industry as it moves past the cost crisis.
The coffee bean market is also showing a trend of transitioning from strength to weakness. The World Bank and Rabobank indicate that with a significant rebound in Arabica bean production in Brazil and Colombia, the global coffee surplus for the 2026/27 season could reach 10 million bags. Although Robusta beans remain resilient due to climate risks, Arabica bean prices are expected to fall by about one-third from their 2025 highs, settling within the range of $2.50-$3.00 per pound. Overall, the two major soft commodities will shift from a 'seller's market' toward balance in 2026.
Soybeans, Corn
2025 Review: Soybean prices showed an overall trend of strengthening volatility, with the annual average expected to rise compared to 2024. Price fluctuations were mainly driven by supply-demand dynamics, weather conditions in major producing countries (such as Brazil and the United States), and geopolitical trade developments. Despite ample global supply and expectations of a bumper harvest in Brazil, the U.S. Department of Agriculture (USDA) reported a decline in planted acreage, and sustained procurement demand from China provided support, causing the price center of gravity to shift upward amid fluctuations.
In contrast, corn prices exhibited a weaker trend of low volatility. This was primarily attributed to favorable global grain production conditions, stable growth in key cereal outputs, and relatively loose market supply-demand conditions. Although steady growth in U.S. demand supported rigid feed consumption, limited reductions in global inventory surpluses combined with strong competition from South American corn kept prices under pressure overall.
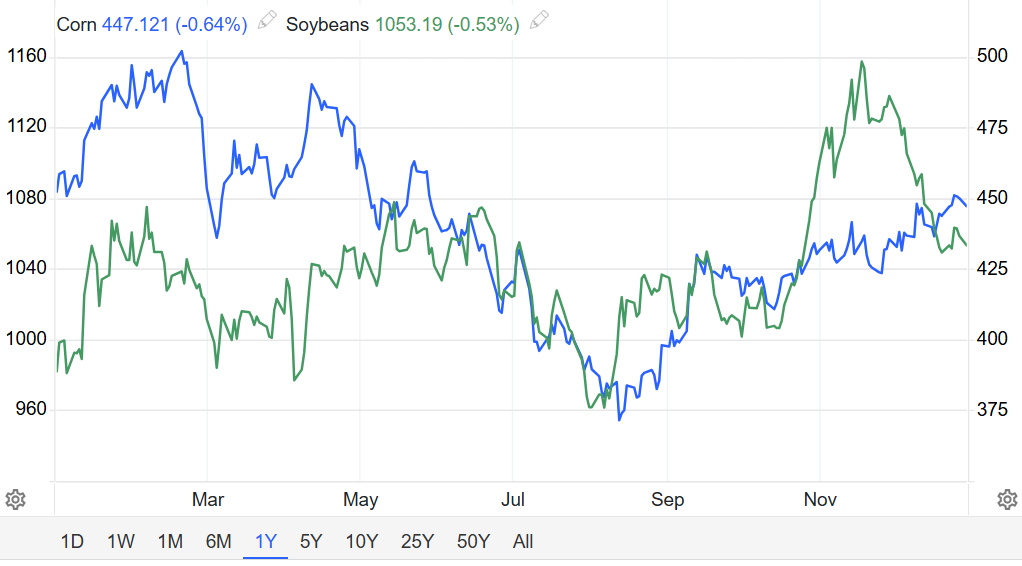
2026 Outlook: The soybean and corn markets will enter a period of 'area adjustment and policy-driven' dynamics. The USDA predicts that soybean acreage will rebound to 85 million acres, supported by the implementation of the U.S.-China trade agreement and biofuel demand. However, global oversupply will weigh on prices, with forecasted average prices slightly declining to $10.30 per bushel. Nevertheless, investment banks like Goldman Sachs argue that if trade purchases exceed expectations, soybeans could see significant valuation recovery.
For corn, the market will transition from 'excess supply' in 2025 to 'active destocking.' With an expected 3.7% reduction in planted acreage, coupled with strong resilience in feed and export demand, corn shows greater resistance to declines than soybeans. Institutions generally expect corn to experience an upward shift in its price center in 2026, with the price midpoint potentially recovering to around $4.50. Overall, the trajectory of agricultural commodities in 2026 will depend on the 'ceiling' of South American production and the balancing point of global trade relations.
Orange Juice, U.S. Eggs
2025 Review: After experiencing historic spikes in 2024, this commodity underwent a deep correction this year. U.S. egg prices plummeted after reaching record highs early in the year. Subsequently, with seasonal demand waning and fewer new cases of avian influenza reported, wholesale prices dropped sharply as fencing construction progressed faster than expected. U.S. egg prices fell below $0.99 per dozen, reaching their lowest level since May 2023. Orange juice also reversed last year's rally, starting the year with a sharp pullback. As expectations for Brazil's orange production continued to improve, downward price momentum persisted. Toward the end of the year, prices rebounded.
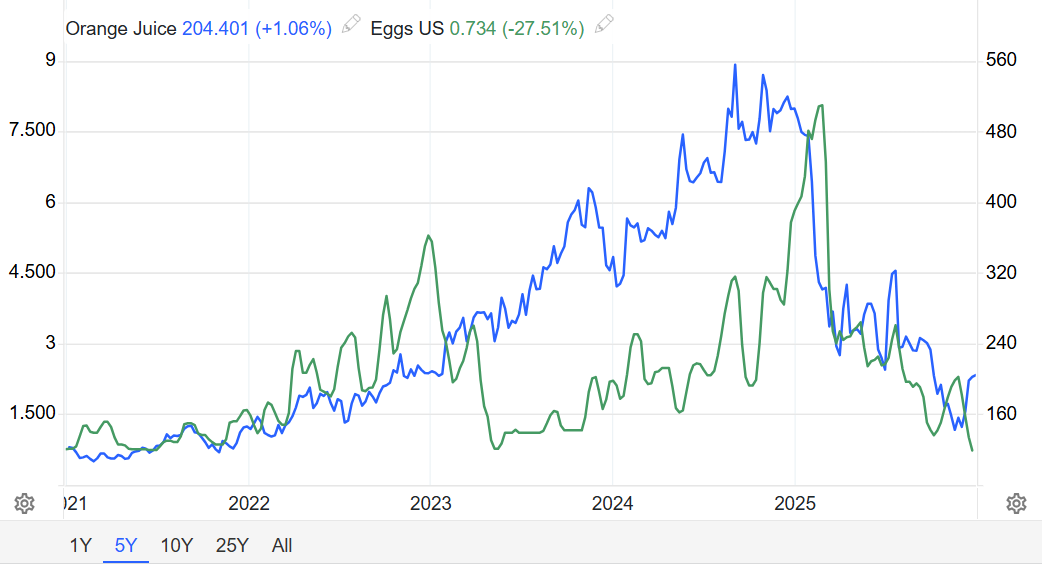
2026 Outlook: According to forecasts from Wall Street investment banks and the U.S. Department of Agriculture, egg prices are expected to decline significantly, while orange juice prices may gradually decrease after experiencing high volatility. The egg market will benefit from the easing of avian influenza outbreaks and restocking of laying hens, with the USDA projecting average prices to drop from about $4 per dozen in 2025 to approximately $2.16 per dozen. Orange juice, on the other hand, faces pressure from weak demand and anticipated increases in Brazilian production. Futures prices are expected to adjust to around $1.88–$2.04 per pound. However, structural issues such as the contraction of Florida's production and the ongoing spread of citrus greening disease will keep prices above historical averages, with risks of supply disruptions persisting.
Editor/Joryn