
Preface
In 2025, the global commodity market delivered a robust performance amid the interplay of multiple forces — the stellar showing of industrial and precious metals offset the mild pullback in the energy sector, driving significant total returns for the commodity index.
Looking ahead to the commodity market in 2026, it will no longer rely solely on the inertia of macroeconomic cycles: On one hand, steady GDP growth and the baseline assumption of Fed rate cuts in 2026 will continue to support the overall performance of commodities; on the other hand, the deepening competition in geopolitical power, technology, and AI fields means that commodities, as strategic resources, are becoming central to global contests, reshaping supply chains and reserve allocation logic worldwide.
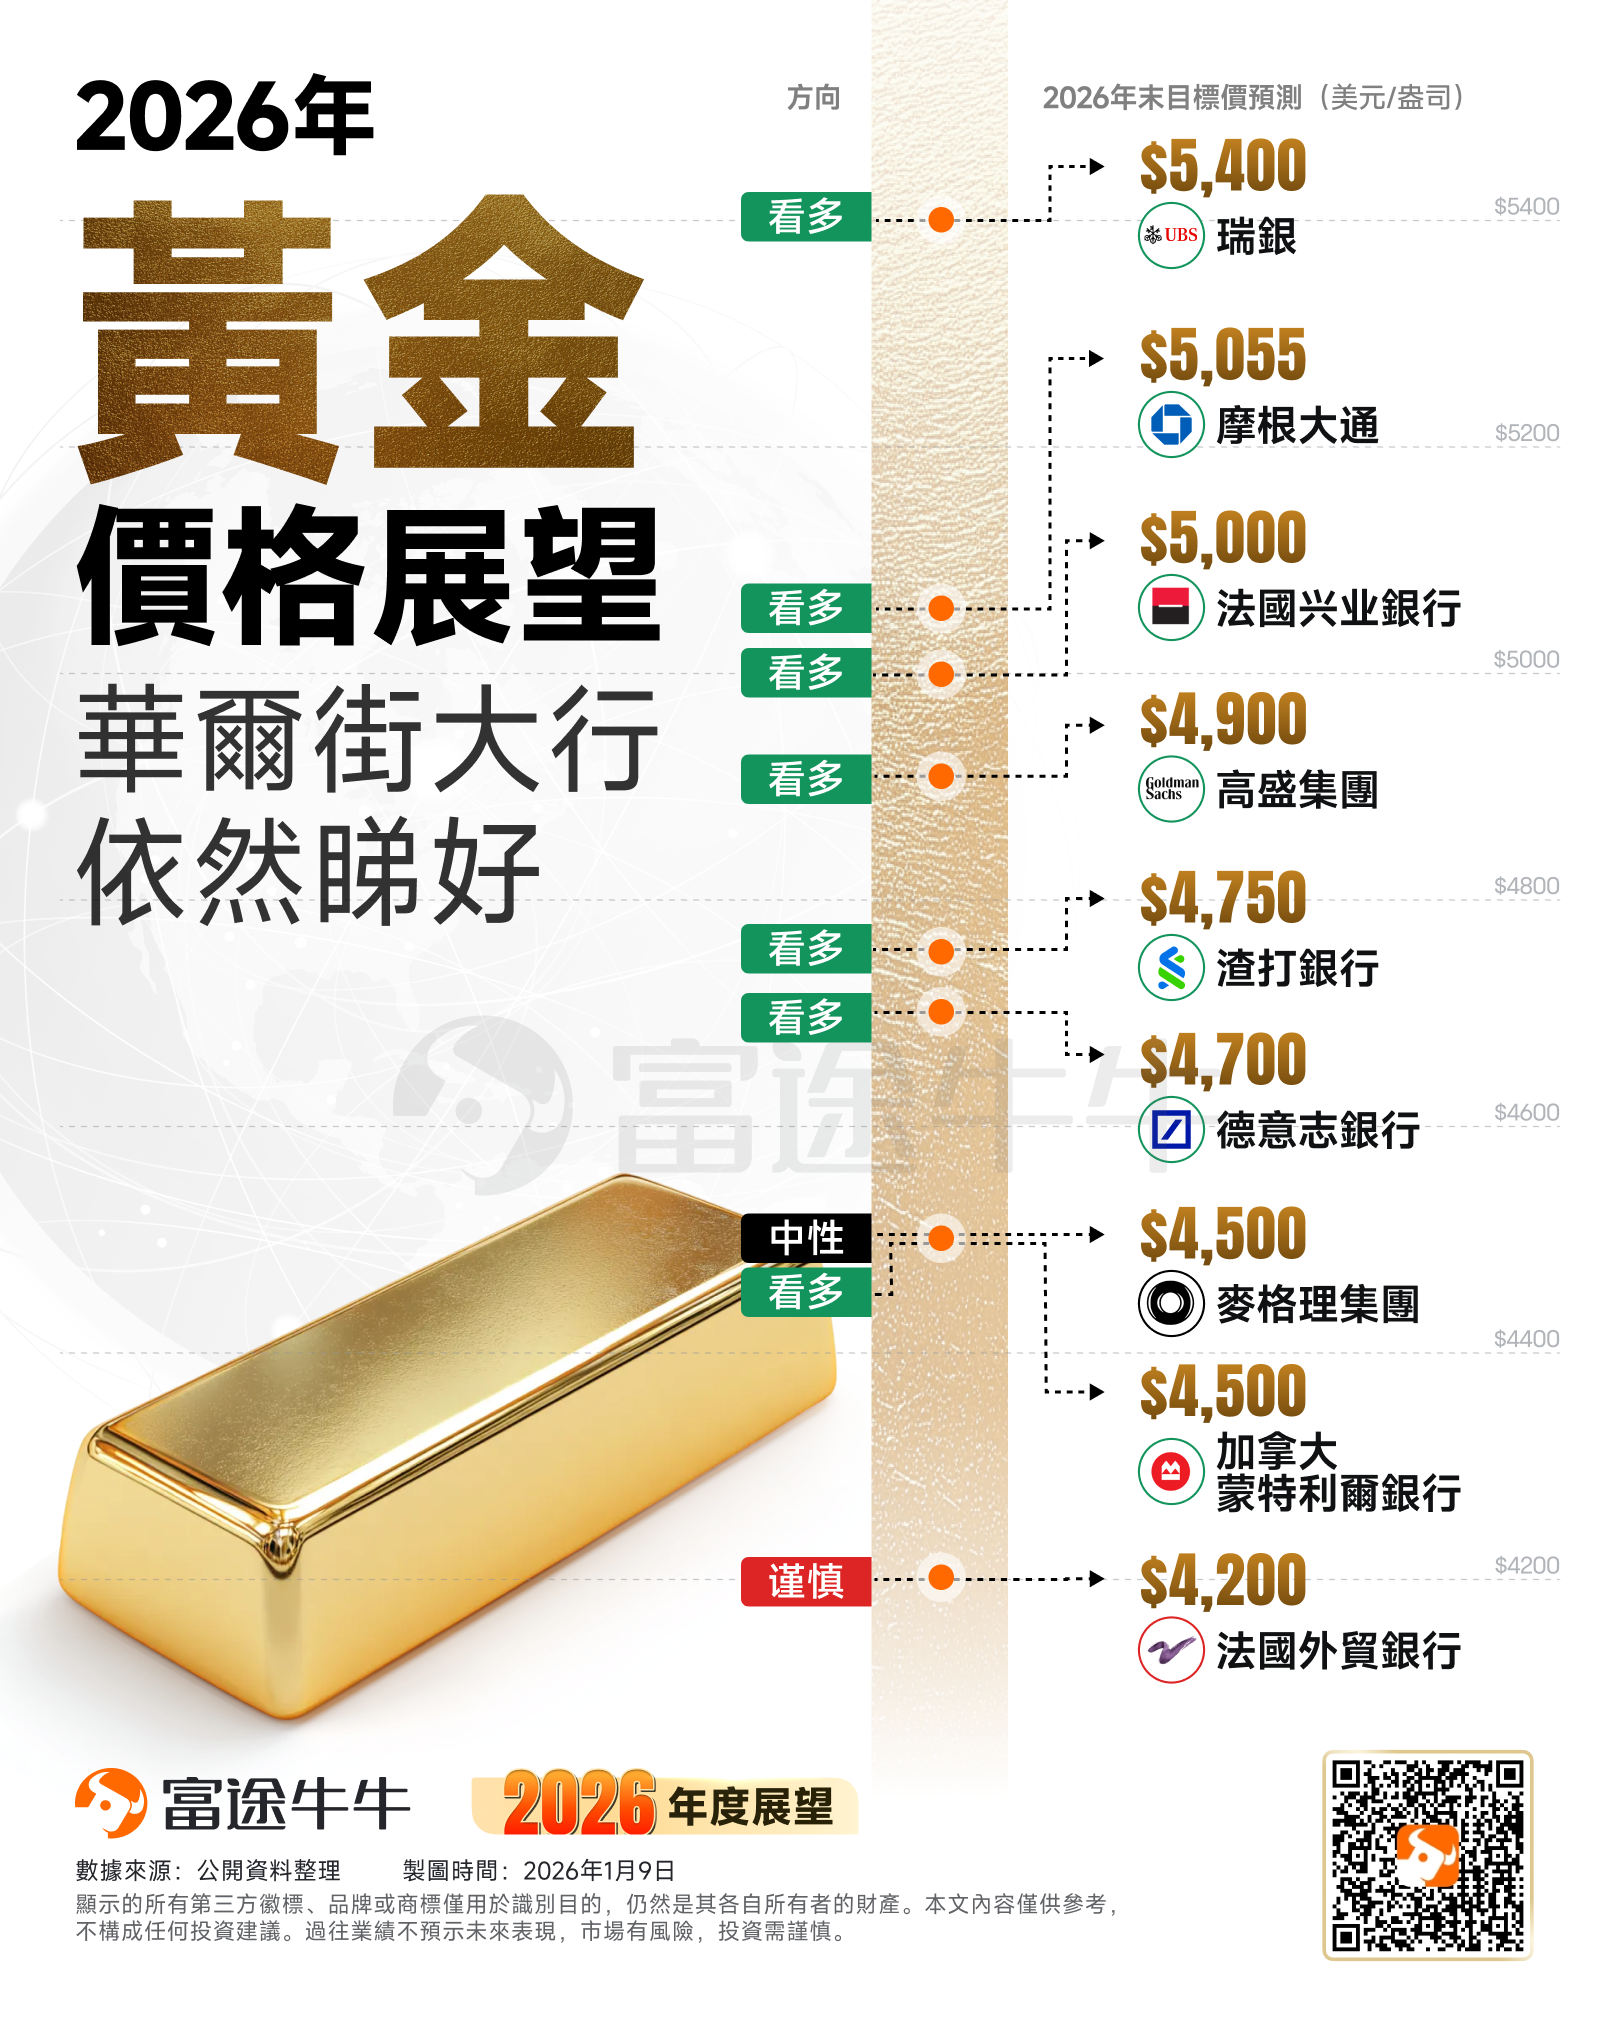
Gold: Expectations of Fed easing open up upside potential, with major banks eyeing $5,000 per ounce
The gold price trend in 2025 can be divided into three main phases, marked by two key turning points: April 22 and October 21. From the beginning of the year to April, gold prices surged due to factors such as easing Sino-US trade relations, escalating geopolitical tensions, and rising expectations of Fed rate cuts. In April, as the White House signaled a “trade easing” tone, gold prices retreated, entering a four-month period of consolidation.
 On August 22, Powell unexpectedly delivered dovish remarks at the Jackson Hole Symposium, officially initiating a rate-cutting cycle. Coupled with heightened risk aversion driven by the US government shutdown crisis, this became the second pivotal turning point. By October 21, renewed escalation of Sino-US trade frictions triggered global market turbulence, propelling gold prices into another strong upward trend. Despite a minor pullback in the short term due to expectations of Fed balance sheet reduction, the overall trend remains consolidative but biased toward strength.
Looking to 2026, Goldman Sachs views central bank gold purchases as a structural force, with average monthly purchases expected to reach 70 tons in 2026 (close to the 2025 monthly average of 66 tons and four times the pre-2022 monthly average of 17 tons); demand from “committed buyers” such as ETF investors remains stable, while private investor allocations show significant potential for growth. Gold prices are projected to rise to $4,900 per ounce by the end of 2026, with quarterly averages climbing progressively (Q1: $4,230, Q2: $4,433, Q3: $4,628, Q4: $4,815), and the precious metals index is forecasted to increase by 11% for the year.
JPMorgan believes that central banks and institutional investors' demand for hedging against inflation/currency uncertainty is increasing, predicting that gold prices could reach $5,055 per ounce by Q4 2026.
On a quarterly basis, Q1 is typically the peak season for physical gold demand (due to the Chinese New Year); Q2 may see stronger easing expectations with the appointment of a new Fed Chair (e.g., faster rate cuts, more aggressive monetary easing); Q3 and Q4 are likely to remain consolidative but biased toward strength, with particular attention on the midterm election results and their impact on policy direction.
Overall, despite a more than 60% increase in gold prices in 2025, fundamental support remains solid. Gold is expected to maintain a consolidative but upward-biased trend in 2026, with close attention to three key variables: progress in Russia-Ukraine peace negotiations, the Fed’s monetary policy path, and the outcome of the US midterm elections.
Among US gold stocks are included $AngloGold Ashanti(AU.US)$、 $Golden Fields Industrial (GFI.US)$、 $Kinross Gold (KGC.US)$ 、 $Newmont (NEM.US)$ 、 $Agnico Eagle Mines (AEM.US)$ 、 $Barrick Mining(B.US)$
US ETFs include $SPDR Gold ETF(GLD.US)$ 、 $Gold Trust Ishares (IAU.US)$ 、 $VanEck Gold Miners ETF (GDX.US)$ Leverage-related products include MicroSectors Gold Miners 3X Leveraged ETN (GDXU.US) 、 $2x Leveraged Gold Miners ETF - Direxion (NUGT.US)、 $2x Leveraged Gold ETF-ProShares (UGL.US) 。
For Hong Kong-listed gold stocks, attention can be paid to $Lingbao Gold (03330.HK)$ 、 $China Gold International (02099.HK)$ 、 $Shandong Gold (01787.HK)$ 、$Zijin Mining (02899.HK)$、$Chifeng Gold (06693.HK)$、 $Zijin Mining (02899.HK)$ 。
Hong Kong-listed gold ETFs include $SPDR Gold ETF (02840.HK)$、 $Value Gold ETF (03081.HK)$ 、 $Hang Seng RMB Gold ETF (83168.HK)$ 。
Silver: Strong fundamentals and macro expectations provide support, but short-term valuation risks need attention
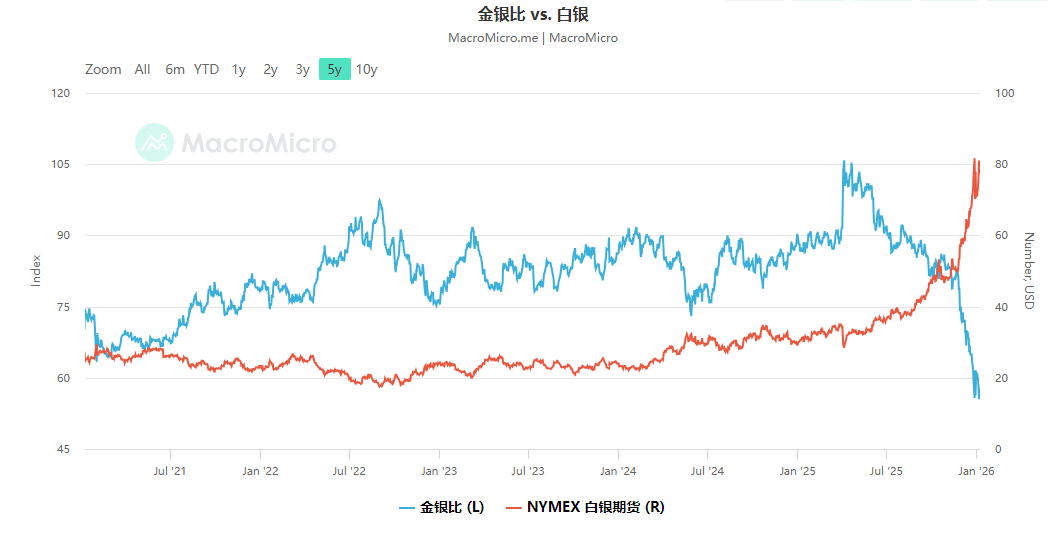
The performance of silver in 2025 can be divided into two main phases: a period of consolidation in the first half and strong upward momentum in the second half. Prior to the end of August, the movement of silver prices will mainly be influenced by global trade conditions and the extent of manufacturing recovery. Due to ongoing trade frictions and sluggish global economic recovery, silver's overall performance will reflect moderate gains, with increases significantly lower than those of gold. However, the gold-to-silver ratio remains at a high level, reflecting its relative weakness.
Entering the second half of the year, as expectations of easing by the Federal Reserve intensify, coupled with events such as the liquidity crisis in London silver and the US government shutdown triggering risk aversion, silver reaches a turning point. Especially after August 22, the tightening of global silver liquidity combined with strengthened expectations of manufacturing recovery drives the entire non-ferrous metals sector higher. Silver, as a precious metal with both investment and industrial attributes, becomes one of the most outstanding performers in the market outlook.
Looking ahead to 2026, market consensus generally holds that silver is supported by a robust upward logic: demand for silver in industrial sectors, particularly in solar panels, electronics, and electric vehicles, along with current shortages in silver inventory, makes it difficult to resolve supply-demand imbalances in the short term, providing strong price support. In terms of investment demand, the continued strengthening of expectations for Federal Reserve easing, a weaker US dollar, and falling Treasury yields will drive an overall recovery in demand for precious metals. As a safe-haven asset similar to gold, silver holds allocation value in a low-interest-rate environment.
In 2026, silver is highly likely to maintain strong momentum, especially driven by manufacturing recovery and new energy demand, offering further upside potential. However, two major risks should be noted: excessive gains in silver prices may have already priced in some positive factors; if the tight liquidity situation is resolved or capital flows back into financial assets, it could trigger significant corrections. Additionally, with the gold-to-silver ratio having declined, if balance cannot be maintained subsequently, there may be a risk of correction following overbuying.
Among U.S.-listed silver stocks are $Endeavour Silver (EXK.US)$、 $Dolly Varden Silver (DVS.US)$ 、 $Silvercorp Metals (SVM.US)$ 、$First Majestic Silver(AG.US)$
US-listed silver ETFs include $ProShares Ultra Silver ETF (AGQ.US)$ 、 $Abrdn Silver ETF Trust(SIVR.US)$ 、$iShares Silver Trust (SLV.US)$、$Sprott Physical Silver Trust(PSLV.US)$、 $Proshares UltraShort Silver ETF (ZSL.US)$
Investors may consider focusing on silver-related stocks in the Hong Kong market, such as $China Silver Group (00815.HK)$ 、$Jinchuan International (02362.HK)$ 、$MMG Limited (01208.HK)$ 。
Copper: The supply-demand gap is expected to persist until 2026, with long-term benefits from electrification.
In 2025, the overall performance of the copper market will be similar to that of silver, exhibiting distinct phased characteristics, but with slower growth and rhythm. In the first half of the year, copper prices experienced significant declines due to escalating Sino-US trade frictions against a backdrop of heightened geopolitical tensions, making copper one of the most heavily corrected commodities in the non-ferrous metals sector.
In the second half of the year, expectations of easing by the Federal Reserve opened upward potential, with disruptions at mining sites acting as a catalyst. As an industrial metal, copper's fundamentals are strongly supported: the development of electrification, the expansion of artificial intelligence data centers, and the construction of green energy infrastructure have driven robust demand. Supply disruptions in Indonesia and Chile tightened global supplies, contributing to a rebound in copper prices in 2025. Strong cost support, particularly in the smelting process, limited downside price pressure, allowing copper prices to gradually stabilize after a decline.
Looking ahead to 2026, the copper market is expected to exhibit a 'tight supply-demand balance with slow-paced fluctuations' characteristic. Mining disruptions will continue, and global copper mine supply will remain tight. However, as copper is a purely industrial metal, high prices will strongly suppress downstream demand, constraining price elasticity and resulting in an overall slower upward trend compared to precious metals, leaning more towards structural opportunities.
Goldman Sachs expects copper prices to consolidate in 2026, averaging $11,400 per tonne for the year, remaining stable in the first half and experiencing a slight decline in the second half. In the short term, potential US tariff expectations will drive prices, with tariff uncertainties persisting until mid-2026, when the US may announce tariffs on refined copper starting in 2027. Declining non-US inventories will support prices, but US inventory sell-offs in the second half of 2026 could pressure prices.
However, it was noted: 'Despite expectations of consolidation in copper prices in 2026, copper remains our most favored industrial metal.' Particularly in the long term, copper benefits from structural demand growth driven by electrification, which accounts for nearly half of copper demand, while unique constraints exist in copper mine supply. Other industrial metals such as aluminum, lithium, and iron ore may see price declines due to increased Chinese overseas investments boosting supply (Indonesian aluminum, African lithium, Guinean iron ore).
Among them, Hong Kong stocks include $Jiangxi Copper Company (00358.HK)$ 、 $Zijin Mining (02899.HK)$ 、 $China Gold International (02099.HK)$ 、 $CMOC (03993.HK)$ 、 $MMG Limited (01208.HK)$ 、 $China Nonferrous Metals Mining (01258.HK)$ 、 $World Gold Group (03939.HK)$ ;
US stocks include$Freeport-McMoRan (FCX.US)$ 、Southern Copper (SCCO.US)、$Teck Resources Limited(TECK.US)$ 、$BHP Group Ltd (BHP.US)$、 $Rio Tinto (RIO.US)$、 Glencore (ADR) (GLNCY.US) 、$Ero Copper(ERO.US)$ 、$Hudbay Minerals(HBM.US)$ 、$Taseko Mines (TGB.US)$ ;
Copper mining ETFs in the US stock market include$Global X Copper Miners ETF (COPX.US)$ 、$SPDR S&P Metals and Mining ETF (XME.US)$ 、$ISHARES COPPER AND METALS MINING ETF (ICOP.US)$、$United States Copper Index Fund (CPER.US)$ $iShares MSCI Global Metals & Mining Producers ETF (PICK.US)$ 。
Lithium carbonate: The ongoing destocking process will continue, with energy storage demand and mining disruptions being key factors.
In 2025, the supply-demand structure of lithium carbonate underwent a structural reversal, with prices rebounding sharply from their low at the beginning of the year to above 120,000 yuan per tonne. In the first half of the year, overcapacity and high inventory levels kept lithium carbonate in a state of oversupply, causing prices to continue falling. However, from mid-year onwards, the introduction of 'anti-internal competition' policies and stricter approval processes for lithium mining licenses in Yichun exacerbated supply-side disruptions. Coupled with rapid growth in energy storage demand, the supply-demand relationship gradually shifted from 'oversupply' to 'tight balance.' Entering the fourth quarter, reduced salt lake lithium production during winter led to supply contraction, while downstream demand for new energy vehicles and energy storage installations continued to exceed expectations, driving a rapid increase in lithium carbonate prices.
Looking forward to 2026, the lithium carbonate market is expected to exhibit characteristics of sustained high demand growth, gradual supply release, upward price movement, but facing pressures:
On the supply side, $CATL (03750.HK)$Production may resume in February, with reduced disruptions from the Yichun lithium mine. Overall supply continues to grow. Meanwhile, technological advancements have driven down the cost of lithium resource extraction, further enhancing supply resilience. However, some new capacity projects, such as brine-based initiatives, are progressing slowly, resulting in limited short-term supply elasticity.
On the demand side, driven by the continuous rise in new energy vehicle penetration rates and the 'dual carbon' policy, demand for lithium in power batteries remains strong; the energy storage sector is entering a phase of explosive growth, particularly driven by new electricity demands such as AI data centers and grid peak shaving, which are boosting installed energy storage capacity. Global lithium resource demand is expected to reach 2.02 million tons by 2026, growing by 33.6% year-on-year, with demand growth significantly outpacing supply growth.
On a quarterly basis, if enterprises such as $CATL (03750.HK)$ resume production in the first quarter, driving an increase in supply, it may trigger short-term pullback risks. In the second quarter, with reduced disruptions on the supply side and new production capacities from companies like Zijin Mining gradually coming online, prices may face pressure if demand growth falls short of expectations while new capacities continue to be added. In the third and fourth quarters, as most new production capacities are brought online, market attention will shift towards demand performance. If demand continues to exceed expectations, prices are likely to maintain a volatile yet upward-biased trend.
Lithium mining companies that may benefit in the Hong Kong stock market include: $$Tianqi Lithium (09696.HK)$ 、$Ganfeng Lithium (01772.HK)$
Lithium mining companies that may benefit in the US stock market include$Albemarle (ALB.US)$ 、$Sociedad Química y Minera de Chile (SQM.US)$ 、$Lithium Americas(LAC.US)$、$Sigma Lithium (SGML.US)$、$Lithium Argentina AG(LAR.US)$ 、$Standard Lithium(SLI.US)$ ;
In addition to individual stocks, investors may also consider gaining exposure to the lithium mining sector through instruments such as ETFs, which allow for one-click allocation while diversifying the risks associated with individual companies.
For example, $SPROTT LITHIUM MINERS ETF (LITP.US)$, with its portfolio more concentrated on upstream resources, including leading global lithium mining companies in the United States and Australia.
Crude Oil: The Final 'Supply Wave' and the Bottoming-Out Moment in 2026
The global oil market is expected to shift from a tight balance to surplus by 2025. Although this process involves macro sentiment disturbances caused by U.S. tariff policies and global trade frictions, returning to micro fundamentals, the core driver of the changing market landscape may lie in adjustments and shifts in supply-side positioning and power. As the era of 'Trump 2.0' unfolds, the reconstruction of the global order is accelerating, and its initial impact on the oil market might be an increase in geopolitical weight within OPEC+ production decisions, demonstrated by OPEC+ initiating a production increase cycle this year at the expense of fiscal revenue, causing the 'oil coin' to tip towards oversupply.
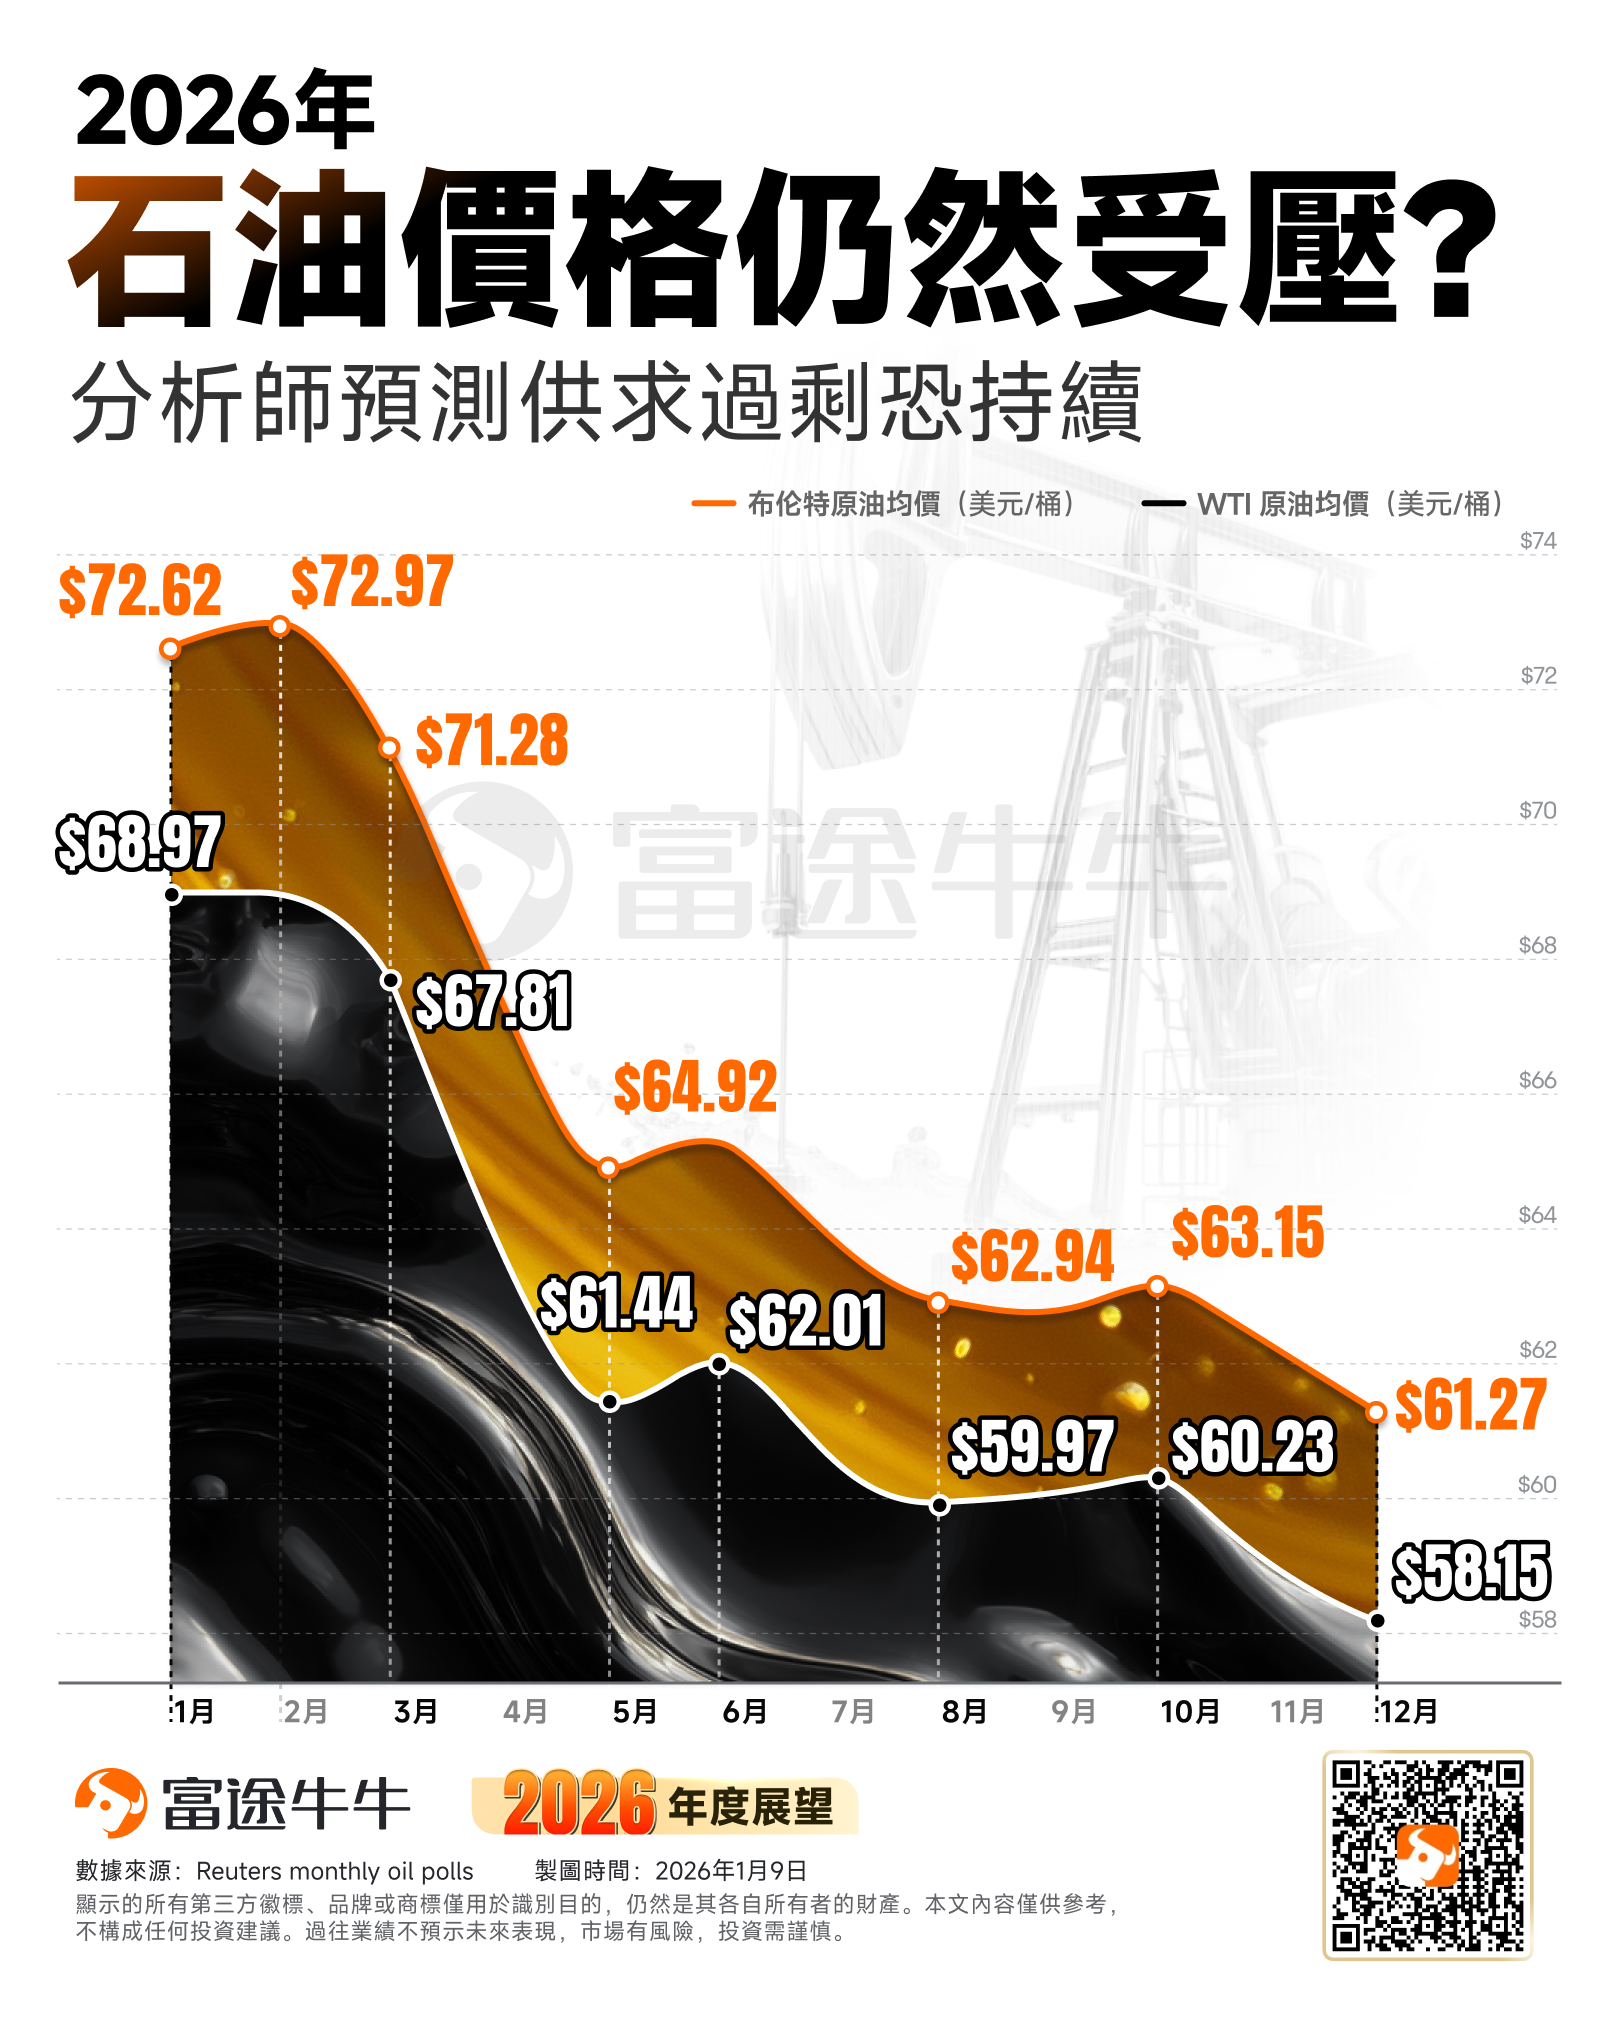
Looking ahead to 2026, incremental crude oil demand will come from the U.S., India, and others, while China's demand will remain stable. Global trade friction and order reconstruction may continue to pressure economic growth and oil consumption in existing demand countries. On the supply side, the micro fundamentals starting in 2025—namely, a large-scale supply wave—will likely be the primary force suppressing oil prices.
According to a December survey forecast conducted by Reuters among 34 economists and analysts, the average Brent crude price for 2026 is projected to be $61.27 per barrel, down from the November forecast of $62.23 per barrel. The WTI crude average price is expected to be $58.15 per barrel, lower than the November forecast of $59.00 per barrel.
Goldman Sachs predicts that crude oil prices will first fall and then rise in 2026, with 2026 witnessing the 'last large-scale supply wave,' resulting in a daily surplus of 2 million barrels. Oil prices are expected to reach their lowest point around mid-2026, with an average Brent crude price of $56 per barrel and an average WTI crude price of $52 per barrel. 'Unless there is a large-scale supply disruption or OPEC cuts production, oil prices may need to decline further in 2026 to rebalance the market post-2026.'
However, as the U.S. rate cuts release incremental demand in the second half of the year, the market begins to anticipate supply-demand rebalancing. Oil prices are expected to hit their lowest point around mid-2026, with a rebound commencing in Q4 as markets start pricing in potential supply shortages in the second half of 2027, shifting focus to incentivizing long-cycle production. Changes in Russian production become a key risk factor in oil price forecasts. In the scenario of a Russia-Ukraine peace agreement, the gradual recovery of Russian production could push the average Brent crude price for 2026 down to $51 per barrel. Conversely, if attacks on Russian oil infrastructure intensify or sanctions escalate, oil prices may exceed baseline forecasts.
Regarding recent events in Venezuela, as the Trump administration converts geopolitical influence into tangible energy interests, Venezuelan oil resources are increasingly flowing to the U.S. mainland. Under the policy framework known as the 'Trump Doctrine,' the U.S. is reshaping the Western Hemisphere's energy map through direct intervention, characterized by transforming previous sanctions and blockades into resource redistribution led by the U.S. If Venezuela forms a pro-U.S. government, Chevron-led oil companies, leveraging existing foundations, will be in the best position to expand their influence. However, it is important to note that Venezuela’s oil infrastructure has severely deteriorated, and recovery faces multiple obstacles. Substantially increasing Venezuelan oil production may take years, destined to be a gradual and localized slow process.
The oil stocks in the US stock market include$Exxon Mobil(XOM.US)$ 、 $Chevron(CVX.US)$ 、 $ConocoPhillips (COP.US)$ 、 $Devon Energy (DVN.US)$、$Ovintiv (OVV.US)$ 、$EQT Energy (EQT.US)$ 、 $Diamondback Energy (FANG.US)$ and $EOG Resources (EOG.US)$
In addition to individual stocks, investors can also participate in oil price movements through crude oil ETFs. The main instruments include: $United States Oil ETF (USO.US)$ , $PowerShares DB Oil Fund (DBO.US)$ , as well as leveraged products $2x Long Bloomberg Crude Oil ETF-ProShares (UCO.US)
Looking to pick stocks or analyze them? Want to know the opportunities and risks in your portfolio? For all investment-related questions,just ask Futubull AI!

Editor/Wendey