
Source: Shenwan Hongyuan Macro
During the Spring Festival, most major overseas stock indexes rose, and crude oil prices strengthened; the US-Iran negotiations reached a deadlock, with the US issuing an ultimatum. The US Supreme Court ruled that reciprocal tariffs were illegal; domestic travel intensity during the Spring Festival holiday continued to rise, with both traditional and unique tourism seeing increased interest.
I. Global Major Asset Classes: Around the Spring Festival holiday, most overseas stock indexes rose, and the renminbi once appreciated to 6.88.
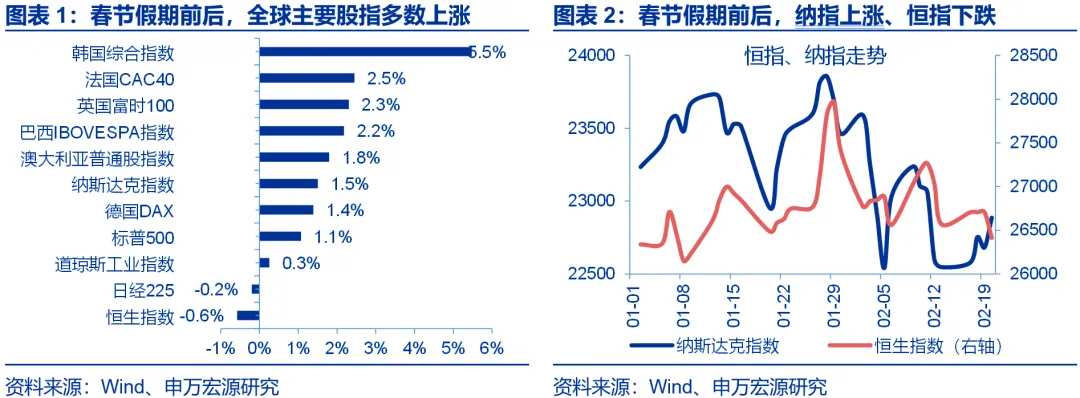
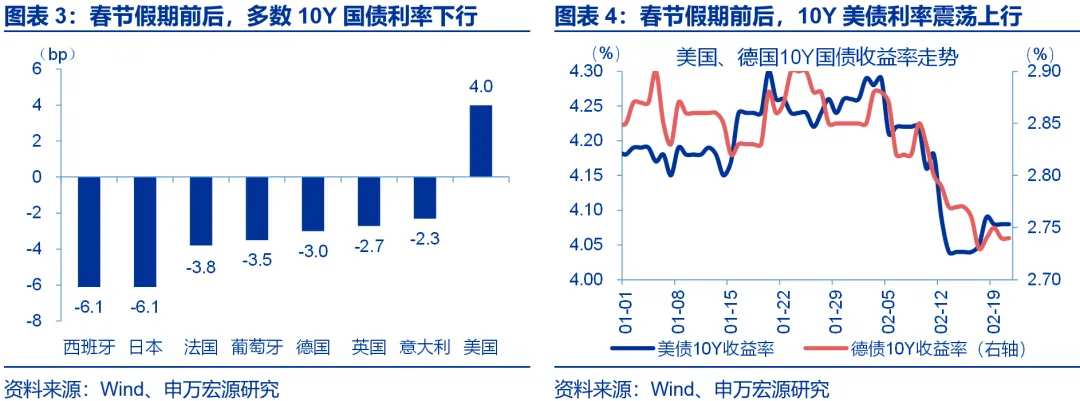
 Around the Spring Festival holiday (February 16-20), most overseas stock indexes rose. In the US stock market, driven by the Supreme Court's ruling that IEEPA tariffs were illegal, which boosted risk appetite, the Nasdaq, S&P 500, and Dow Jones Industrial Average rose by 1.5%, 1.1%, and 0.3% respectively. In Asian markets, the KOSPI surged by 5.5%, while the Hang Seng Index fell by 0.6%. In Europe, the CAC40, FTSE 100, and DAX30 collectively rose.
Around the holiday period, the US Dollar Index rebounded by 0.9%, and the offshore renminbi once appreciated to 6.88. The rebound of the US Dollar Index was mainly due to the widening of the US-Germany interest rate differential; during the holiday, due to divergent inflation trends, the 10-year US-Germany interest rate differential widened by 7 basis points. Benefiting from the 'foreign exchange settlement wave,' despite the rapid rebound of the US dollar, the offshore renminbi still maintained a strong performance and once appreciated to 6.88.
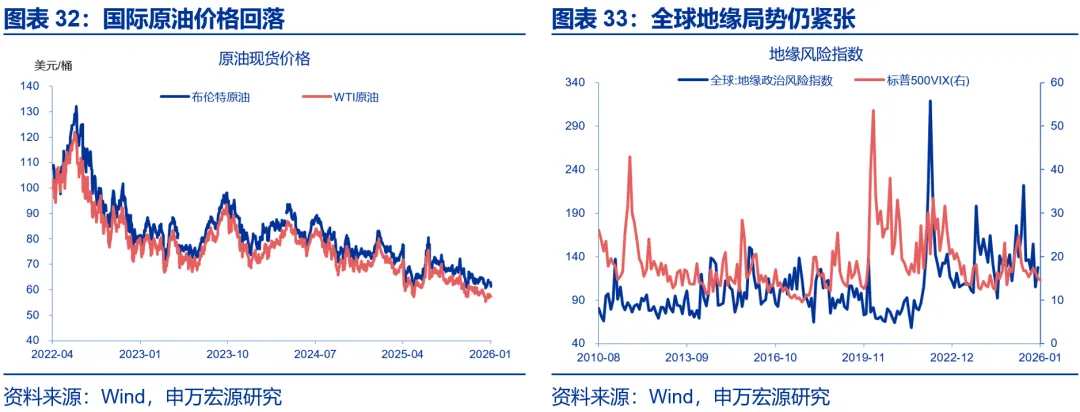
Around the holiday period, oil prices continued to strengthen, and gold prices trended higher with fluctuations. In the crude oil market, driven by the rejection of tariffs boosting demand and escalating tensions in Iran, WTI crude oil and Brent crude oil surged by 5.7% and 5.9%, respectively, reaching $66.5 and $71.8 per barrel. Although gold was suppressed by the rebound of the US dollar, geopolitical risk aversion and stagflation expectations supported its resilient rise, with London gold increasing by 1.2% to $5053.2 per ounce.
II. Overseas Fundamentals & Data: US real GDP growth weaker than expected, US Supreme Court rules IEEPA tariffs illegal.
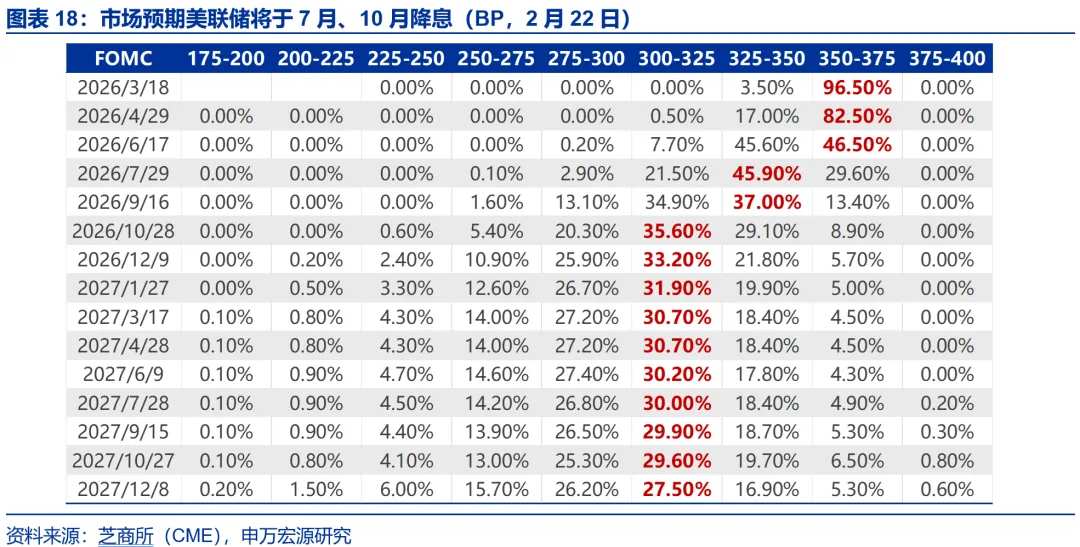
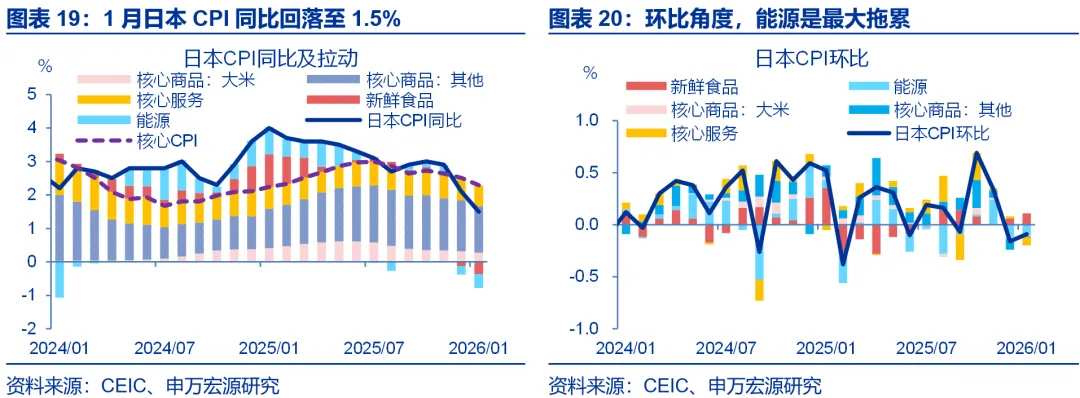
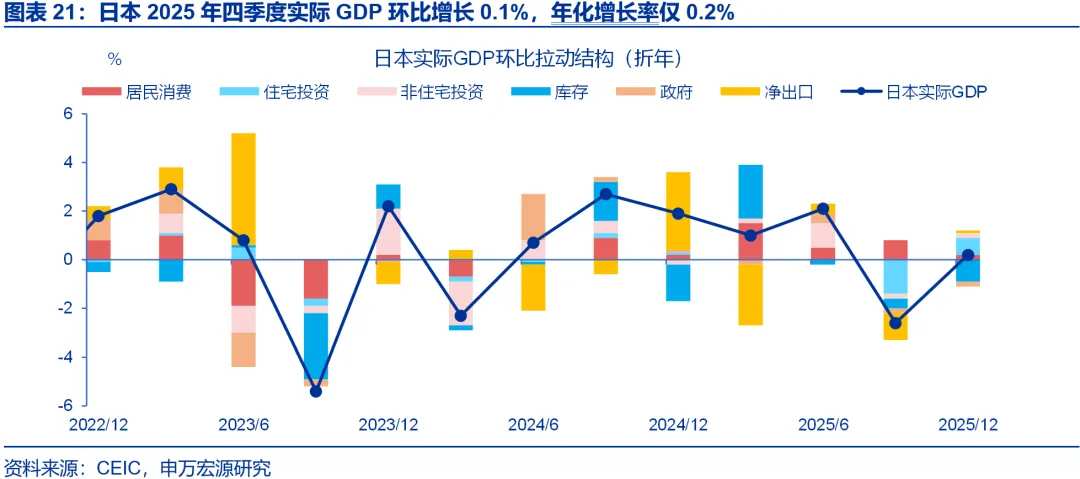
US Q4 real GDP growth weaker than expected, Japan's January CPI year-on-year fell back to 1.5%. US Q4 real GDP grew at an annualized rate of 1.4%, weaker than the market expectation of 3%, with significant impacts from the government shutdown; the Fed's January minutes highlighted diverging views; Japan’s January CPI year-on-year was 1.5%, dragged down by energy and base effects; Japan’s Q4 economic growth was weaker than expected, with an annualized quarter-on-quarter growth of only 0.2%.
The US Supreme Court ruled that IEEPA tariffs are illegal. On February 20, the US Supreme Court overturned Trump's 'IEEPA tariffs' by a 6-3 vote. Trump immediately announced a 10% tariff on all imports under Section 122, which was raised to 15% on the 21st. In the short term, US tariff rates may slightly decrease, but in the long run, the Supreme Court ruling is unlikely to change the overall tariff landscape, and tariffs may still exist for a long time.
US-Iran negotiations reached a deadlock, with the US issuing an ultimatum. On February 17-18, the US and Iran held the second round of negotiations, where they reached only a weak consensus on procedural guidelines, with significant differences on core issues. On February 19, Trump stated that if a 'meaningful agreement' could not be reached within 10-15 days, the US might take 'further military action.' Geopolitical risks in the Middle East remain a possibility.
III. Domestic Events & Data: Travel intensity during the Spring Festival holiday continued to rise, with both traditional and unique tourism seeing increased interest.
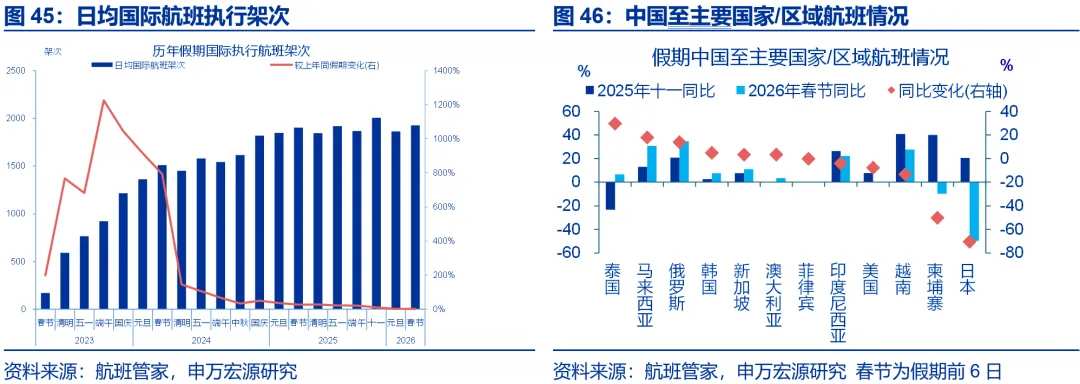
During the Spring Festival holiday, the intensity of people's travel continued to rise, and domestic tourism saw a rebound in popularity. 1) The intensity of people's travel continued to increase year-on-year from -5% on the second day of the holiday to 12.3% on the sixth day; 2) In terms of flight conditions, the number of domestic flights increased by 1 percentage point year-on-year compared to the National Day holiday, reaching 3%, while international flights fell by 9.1 percentage points year-on-year to 1.3%; 3) Traditional scenic spots such as those in Sichuan Province regained popularity, and distinctive tours such as “Intangible Cultural Heritage Tours” performed remarkably well.
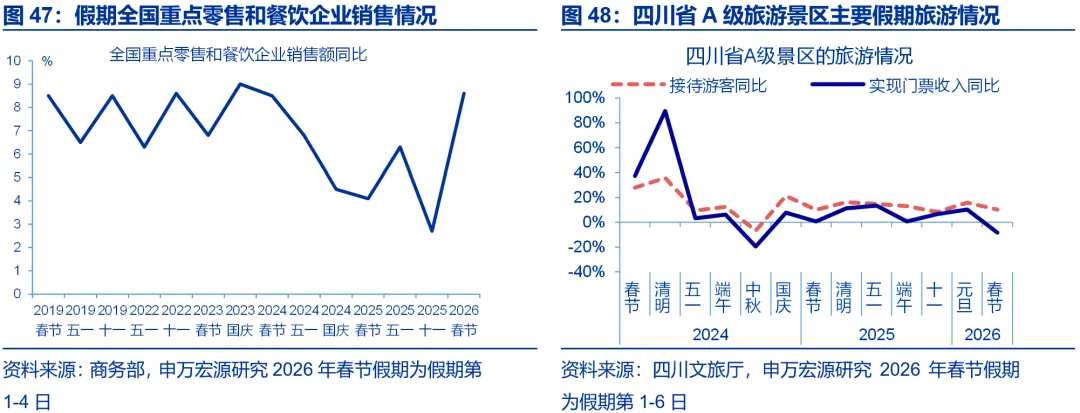
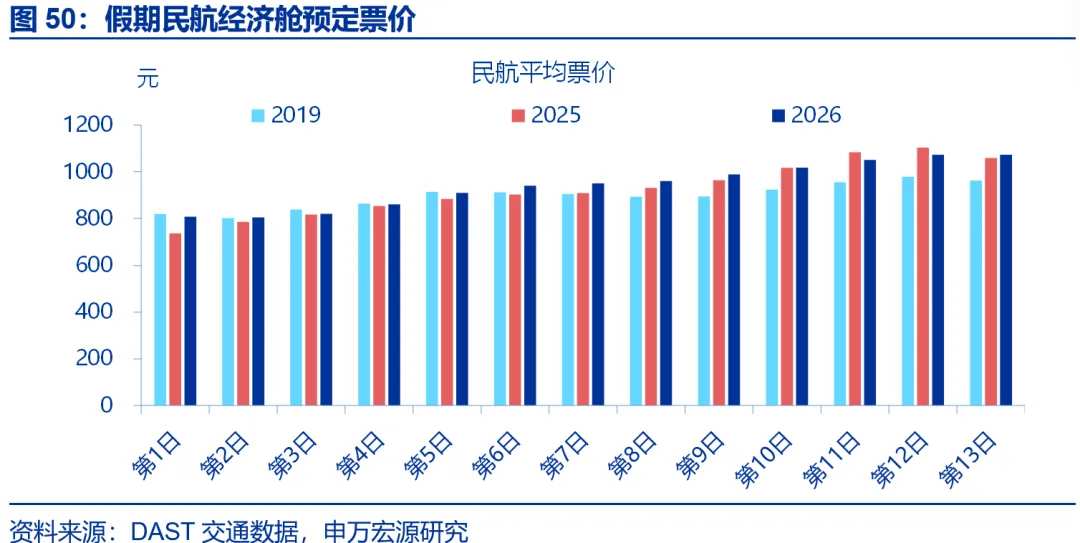
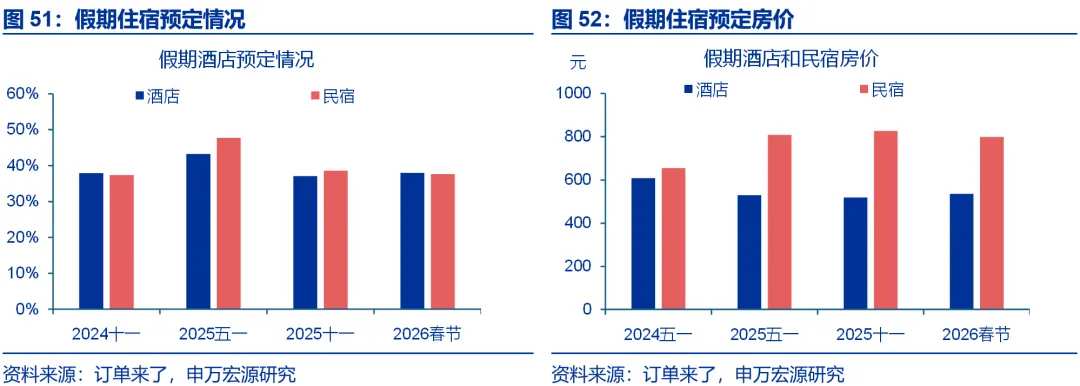
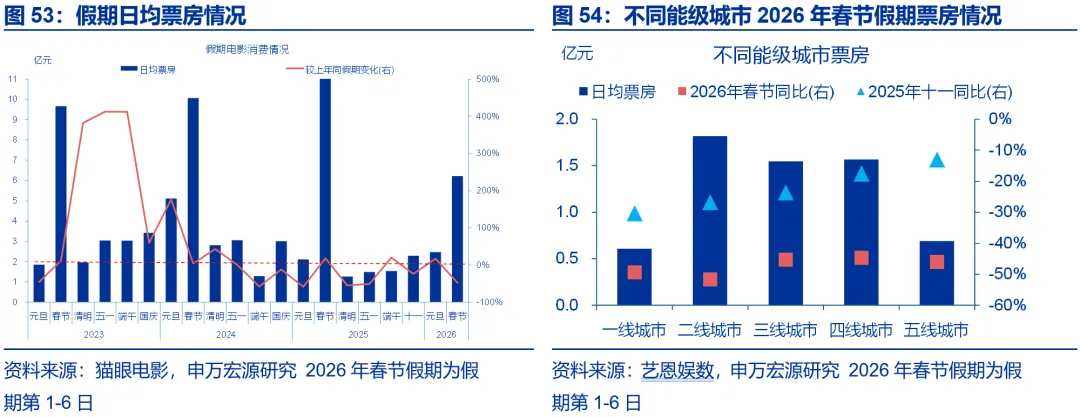
Prices remained generally stable, with hotel and airfare prices rising, while movie ticket prices were relatively weak. 1) During the first four days of the holiday, sales of key retail and catering enterprises nationwide increased by 8.6% year-on-year, up 5.9 percentage points compared to the National Day holiday in 2025; 2) The average pre-sale price for air tickets during the Spring Festival travel season was 908 yuan, higher than the same period last year; 3) Hotel reservation prices rose by 5.4% year-on-year, while homestay prices remained flat compared to last year; 4) The average movie ticket price decreased by 4.5% year-on-year, falling by 12.7 percentage points compared to the National Day holiday.
Before the festival, the Qiushi Journal published an important article by the General Secretary titled 'Key Tasks for the Current Economic Work.' The article explicitly pointed out that the current economic priorities are to precisely redirect policy focus towards implementing urban-rural income growth initiatives and optimizing the 'two new' policies, vigorously deepening and expanding the layout of 'Artificial Intelligence+' and strategic emerging industries, and fully stimulating the vitality of all types of business entities while advancing the construction of a unified national market.
Risk Warning
Escalation of geopolitical conflicts; stronger-than-expected slowdown in the U.S. economy; unexpected hawkish shift by the Federal Reserve
Main Body of the Report
During the Spring Festival, most major overseas stock indices rose and crude oil prices strengthened; U.S.-Iran negotiations reached a deadlock, with the U.S. issuing an ultimatum, and the U.S. Supreme Court ruling reciprocal tariffs illegal; domestic travel intensity during the Spring Festival holiday continued to rise, with both traditional and distinctive tourism seeing升温 (a warming trend).
I. Global Asset Classes: Around the Spring Festival holiday, most overseas stock indices rose, and the renminbi once appreciated to 6.88.
(I) Improved risk appetite in overseas markets led to rises in most stock indices.
Around the Spring Festival holiday (February 16th-20th), most major overseas stock indices rose. In the U.S. stock market, buoyed by improved risk appetite due to the Supreme Court’s ruling against IEEPA tariffs, the three major indices collectively rose, with the Nasdaq, S&P 500, and Dow Jones Industrial Average increasing by 1.5%, 1.1%, and 0.3%, respectively. In the Asian market, driven by semiconductor catalysts, the Korea Composite Index surged by 5.5%, while the Nikkei 225 and Hang Seng Index fell by 0.2% and 0.6%, respectively. In Europe, France’s CAC40, the UK’s FTSE 100, and Germany’s DAX increased by 2.5%, 2.3%, and 1.4%, respectively.
(II) U.S. Treasury yields rebounded slightly, while European bond yields mostly declined.
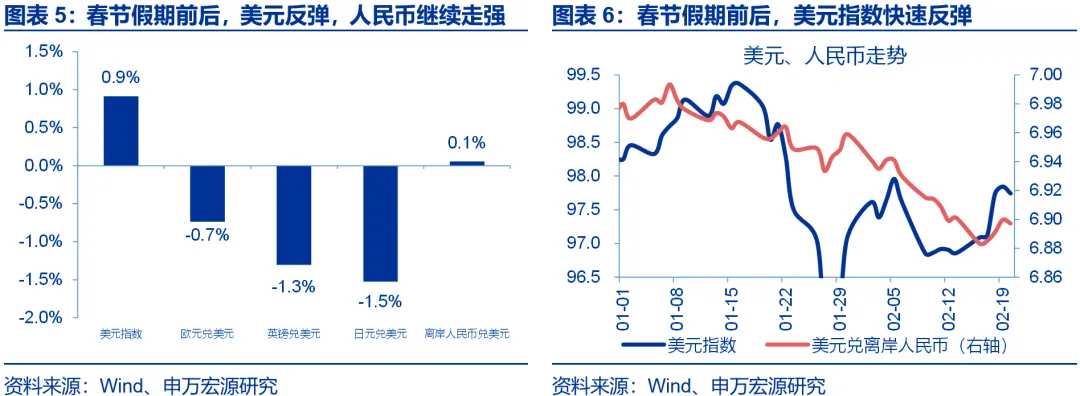
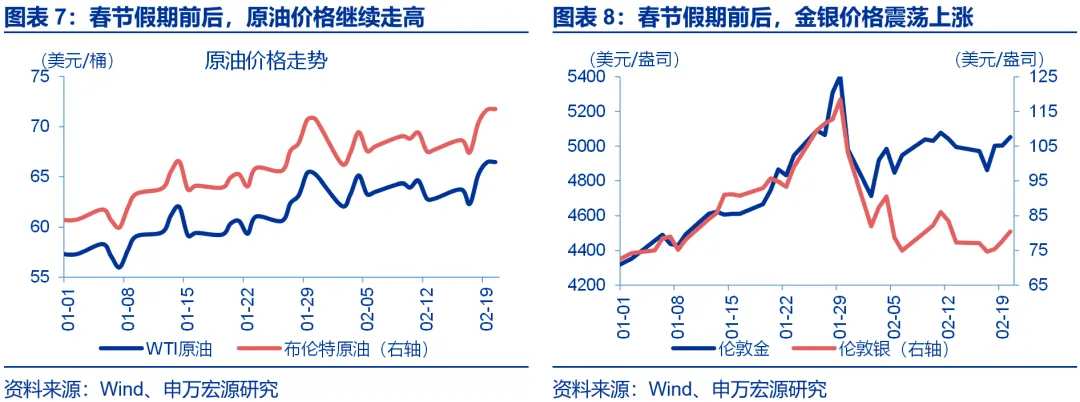
Around the Spring Festival holiday (February 16th-20th), long-term government bond yields in most developed countries declined. Influenced by strong PCE data, the 10-year U.S. Treasury yield rose by 4.0 basis points to 4.08%. In other bond markets, driven by a decline in inflation expectations, European bond yields collectively fell, with 10-year yields in Spain, Japan, France, Portugal, Germany, the UK, and Italy declining by 6.1bp, 6.1bp, 3.8bp, 3.5bp, 3.0bp, 2.7bp, and 2.3bp, respectively.
(3) The US Dollar Index rebounded sharply, and the offshore RMB continued to strengthen.
Around the Spring Festival holiday (February 16-20), the US Dollar Index rebounded by 0.9%, while the offshore RMB once rose to 6.88. The euro, pound, and yen depreciated against the dollar by 0.7%, 1.3%, and 1.5%, respectively. The rebound of the US Dollar Index was mainly due to the widening interest rate differential between the US and Germany. During the holiday period, the divergence in inflation trends widened the 10-year US-Germany spread by 7 basis points. However, benefiting from the 'foreign exchange settlement wave,' the offshore RMB maintained strong performance despite the rapid rebound of the US dollar, rising to 6.88 at one point.
(4) Crude oil prices continued to rise, with gold and silver prices fluctuating upward.
Around the Spring Festival holiday (February 16-20), oil prices continued to rise, while gold prices fluctuated higher. In terms of crude oil, the US Supreme Court's rejection of a tariff bill boosted global trade recovery prospects, and escalating geopolitical tensions in Iran reignited concerns about supply disruptions. Favorable factors on both supply and demand sides pushed WTI crude and Brent crude prices up by 5.7% and 5.9% to $66.5 per barrel and $71.8 per barrel, respectively. Regarding gold, although the rebound of the US Dollar Index and the rise in US Treasury yields slightly pressured gold, safe-haven buying driven by Iranian geopolitics and hedging demand amid 'weaker GDP + rebounding PCE' supported gold prices, resulting in a volatile increase. London gold rose by 1.2% to $5,053.2 per ounce.
II. Overseas Fundamentals & Data: US economic growth weaker than expected; US Supreme Court rules reciprocal tariffs illegal.
(1) US GDP: Q4 real GDP growth weaker than market expectations.
The Q4 US GDP growth was weaker than expected, but the full-year growth for 2025 still reached 2.2%. The Q4 US real GDP grew by 1.4% quarter-on-quarter (annualized), below market expectations of 3% and lower than 4.4% in Q3. According to the Atlanta Fed's GDPNow forecast before the data release, the main drag came from government consumption and investment. Overall, however, the annual economic growth rate for the US in 2025 was 2.2%, significantly stronger than early 2025 market expectations.
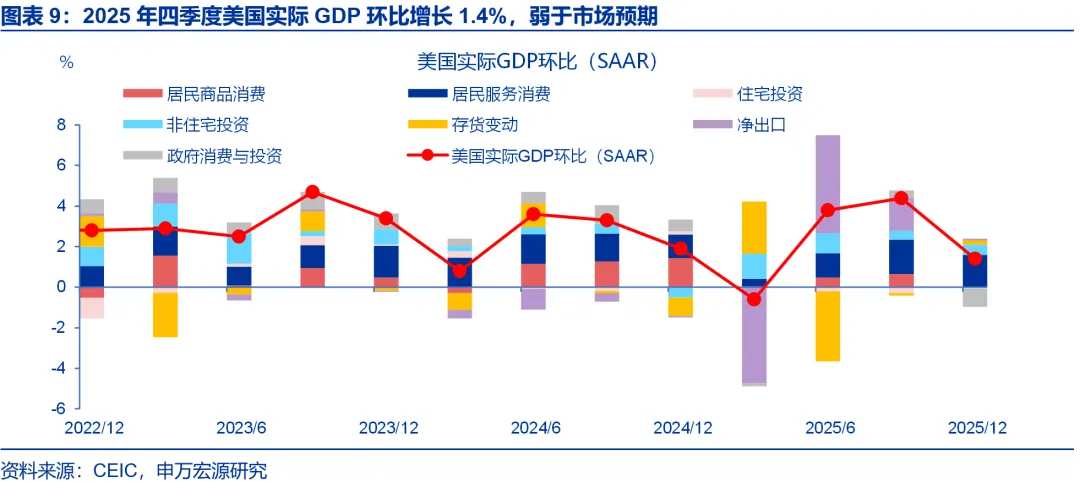
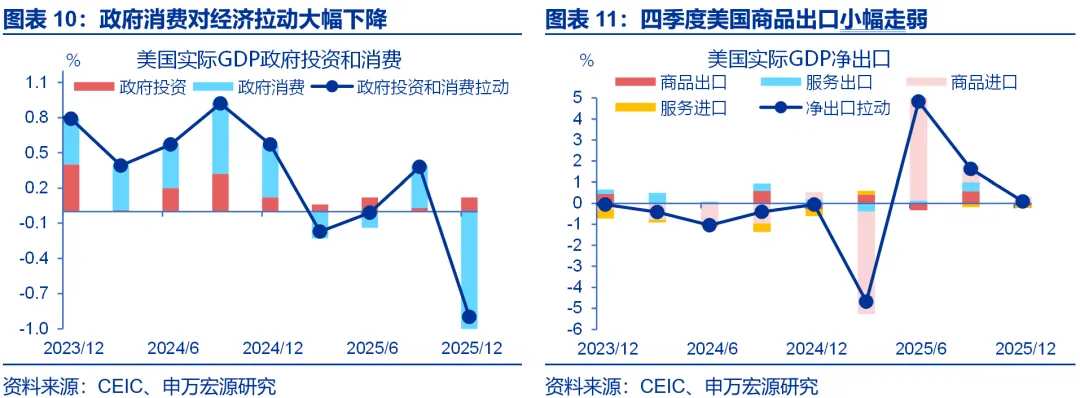
In Q4, the longest government shutdown in history caused government consumption to weigh heavily on economic growth. The biggest drag on Q4 US GDP data came from the government sector, with government consumption reducing real GDP growth (quarter-on-quarter annualized) by 1 percentage point, compared to a 0.36-percentage-point boost in Q3. The government shutdown was the primary factor. However, this effect is temporary, and government consumption is likely to rebound in Q1.
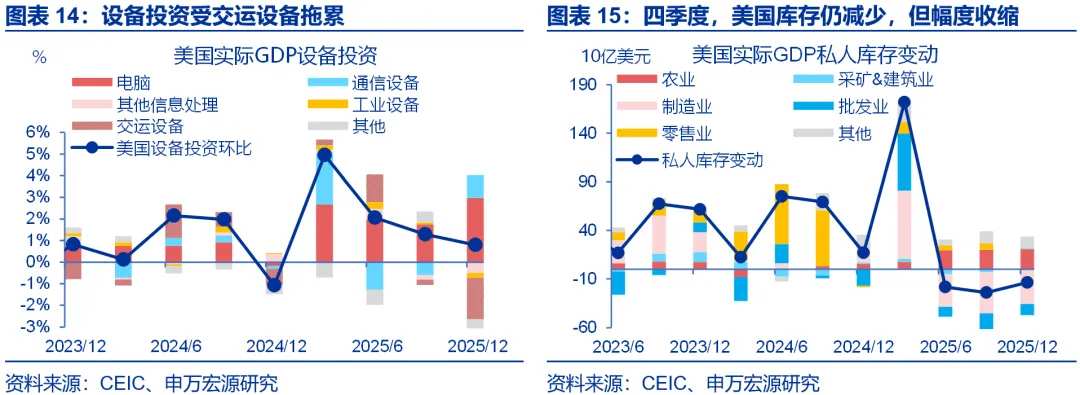
AI-related investments remained robust in Q4, inventory declines narrowed, and residential investment marginally improved. Private investment contributed 0.66 percentage points to real GDP growth (quarter-on-quarter annualized) in Q4, compared to 0.03 percentage points in Q3, primarily driven by inventory changes followed by residential investment. 1) In residential investment, as the Federal Reserve cut rates and Trump's policies improved housing affordability, the US real estate market may enter a phase of 'moderate' recovery in 2026. 2) In non-residential investment, intellectual property investment increased, while equipment investment slowed, partly due to weak auto sales and tariff uncertainties impacting transportation equipment. In other words, AI-related investments still supported economic growth in Q4. 3) Inventory changes contributed 0.21 percentage points to economic growth in Q4, improving by 0.33 percentage points from Q3, reflecting a narrowing decline in private inventories. As previously stockpiled inventory is consumed, the US inventory cycle may shift toward restocking.
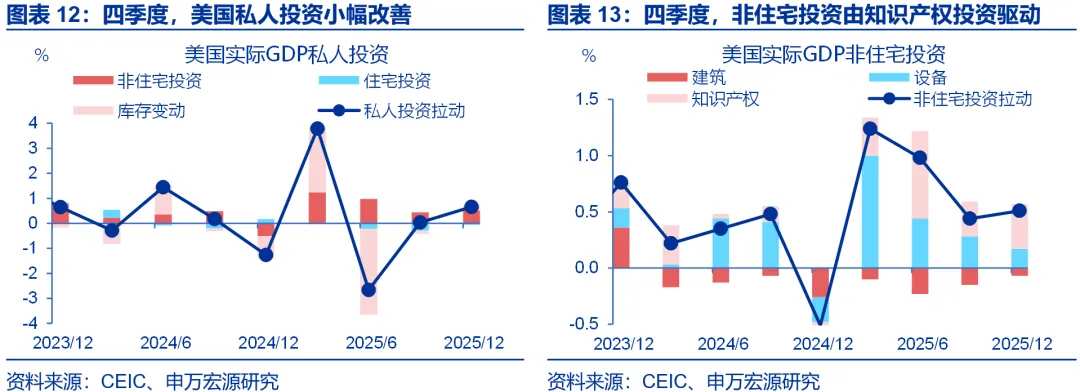
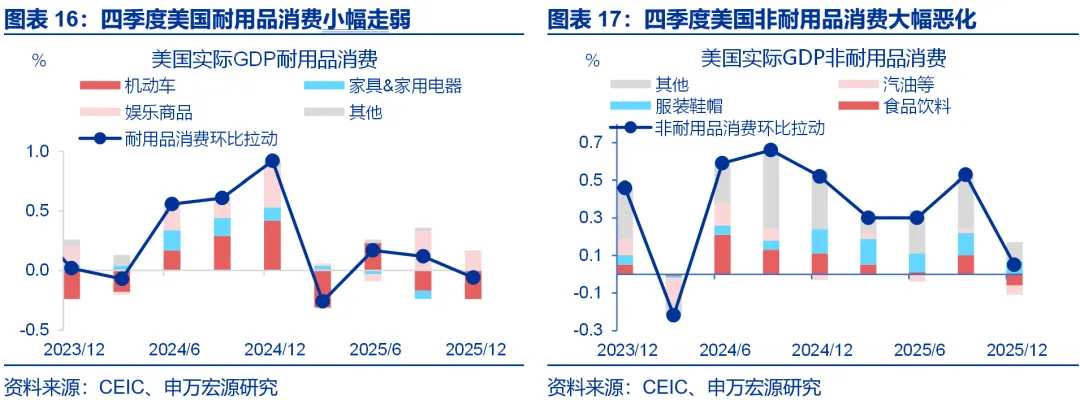
Both goods and services consumption weakened for US households in Q4. Goods and services consumption contributed -0.01 and 1.59 percentage points, respectively, to real GDP quarter-on-quarter growth in Q4, down from 0.64 and 1.70 percentage points in Q3, with goods consumption showing a larger decline. Within goods consumption, non-durable goods consumption fell sharply, possibly affected indirectly by the government shutdown (e.g., interruptions in food stamp distribution), while durable goods consumption was mainly dragged down by motor vehicles.
(2) The Federal Reserve: January minutes show severe divergence in officials' views.
The January 2026 minutes of the United States show a significant divergence in officials’ views. In addition to the mainstream wait-and-see faction and the rate-cutting faction, the minutes explicitly stated for the first time that 'some participants expressed support for adopting a 'two-way' statement in the forward guidance on interest rates, implying that a policy rate hike is possible provided inflation remains persistently above target.' Currently, against the backdrop of a still relatively robust labor market, inflation concerns remain the core focus. In addition to earlier tariff-driven increases in goods inflation and housing inflation aiding the cooling of services inflation, several participants also projected that productivity improvements related to technological or regulatory developments would place downward pressure on inflation. Notably, several participants mentioned excessively high asset valuations and historically low credit spreads. Some participants discussed potential vulnerabilities arising from recent developments in the AI sector, including elevated stock market valuations, highly concentrated market capitalization and activity among a few companies, and increased debt financing.
(3) Japan's Inflation: January CPI year-on-year fell to 1.5%.
Japan’s January CPI year-on-year fell to 1.5%, with energy prices being the main influencing factor. In January 2026, Japan’s CPI was up 1.5% year-on-year, with core inflation continuing to weaken. The main driver behind the overall CPI slowdown came from falling energy prices, influenced by the cancellation of gasoline surcharges and the continuation of fuel subsidies, along with some base effects. Beyond this, food prices maintained a slight upward trend, while core services inflation continued its cooling trajectory.
(4) Japan's GDP: Q4 economic growth weaker than market expectations.
Japan’s Q4 economic growth was weaker than market expectations. Japan’s real GDP for Q4 of 2025 grew by 0.1% quarter-on-quarter, with an annualized growth rate of just 0.2%, below market expectations (0.4% QoQ / 1.6% annualized). Structurally, residential investment improved quarter-on-quarter in Q4, while household consumption weakened slightly. Attention should be paid to the results of Japan’s 2026 'Spring Wage Offensive'.
(5) US Supreme Court rules reciprocal tariffs illegal.
Key News: On February 20, 2026, the US Supreme Court ruled 6-3 that Trump’s 'reciprocal tariffs' were illegal.
On February 20, 2026, the US Supreme Court issued a ruling declaring reciprocal tariffs illegal. The core reasoning of the ruling was as follows: Reciprocal tariffs violated both the clear authorization principle and the major questions doctrine. The former refers to the fact that the IEEPA text, which Trump relied upon to impose tariffs, did not include terms such as 'tariffs' or 'duties,' meaning that the imposition of reciprocal tariffs and fentanyl tariffs based on IEEPA contravened the core principle requiring administrative authorization to be clearly defined. The latter states that major economic policies with nationwide implications must have explicit legal authorization from Congress, yet Congress had not provided any specific authorization within IEEPA. The tariff measures ruled illegal for Trump are as follows: 1) Fentanyl tariffs, with a 20% rate on China (10% temporarily exempted in November), 25% on Canada, and 25% on Mexico; 2) Global reciprocal tariffs, including a 10% baseline tariff and country-specific additional tariffs.
The Supreme Court ruling did not address refund arrangements, leaving unclear who will receive refunds, how much, and when. A comprehensive refund appears unlikely. 1) The refund process has been legally separated and will be handled independently. The Supreme Court delegated the refund issue to the CIT court, meaning the refund process may take longer. 2) Not all IEEPA tariffs need to be refunded. According to US Customs data as of November 2025, total reciprocal tariff revenue reached $133.5 billion, and the amount to be refunded will depend on how lower courts handle the scope of relief. The upper limit would be a full refund, while the lower limit would involve refunds only to direct plaintiffs, with the baseline scenario being partial refunds within a defined range. Goods with preserved claims or those subject to litigation are more likely to receive refunds. 3) The likelihood of an automatic full refund is low. Referring to the principle of equitable judicial relief (Trump v. CASA, 2025), the scope of relief must match the harm suffered by plaintiffs, meaning comprehensive and automatic refunds might not be legally supported. Refunds may require manufacturers to actively pursue litigation, and Trump has signaled clearly that rapid refunds will not occur.
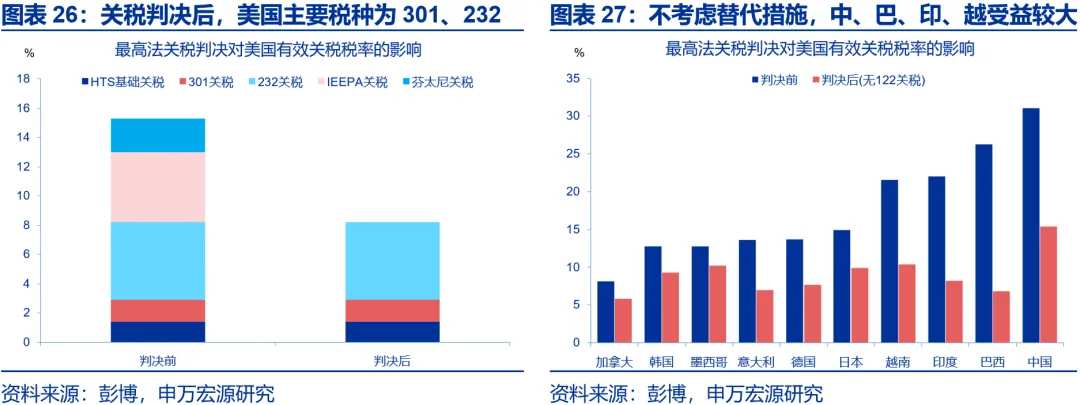
Trump's statements were firm, announcing a 10% global tariff increase under Section 122, which was raised to 15% on the 21st, without mentioning Section 338. After the ruling, Trump adopted a tough stance, using extreme language to criticize dissenting Supreme Court justices, calling those opposing tariffs 'a national disgrace.' In practical measures, Trump announced a 10% global tariff hike under Section 122 on the 20th, and on the 21st increased it to the 15% cap. Products such as key minerals, natural resources, agricultural products, pharmaceuticals, electronics, automobiles, and aerospace were exempted, as were products compliant with the USMCA agreement. Moreover, the Section 122 tariff does not overlap with the Section 232 tariff, potentially allowing time for interim arrangements regarding Section 301 and Section 232 tariffs but without mentioning the 50% tariff measure under Section 338.
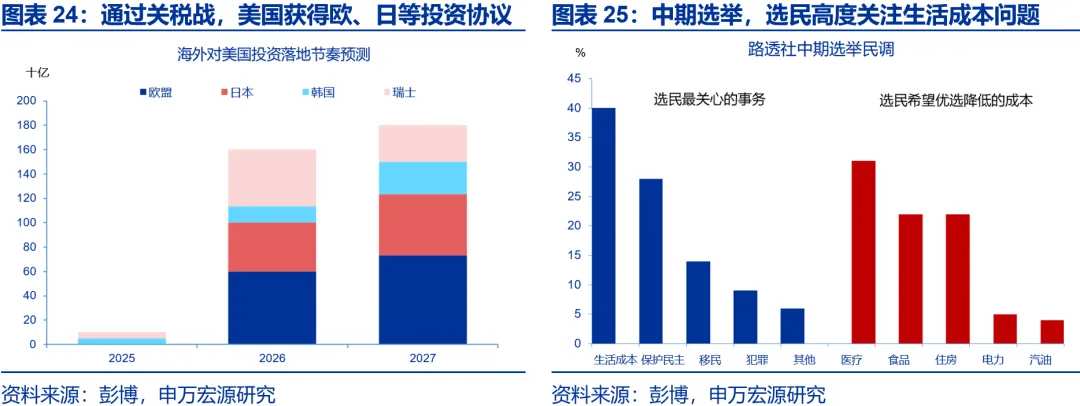
Trump’s tariff strategy may be: preserving the existing tariff framework, avoiding nullification of the achievements from the trade war, but not necessarily escalating further. By 2025, through the trade war, the Trump administration achieved two major outcomes: fiscal revenue and investment agreements. With tariffs, the U.S. fiscal deficit rate in 2025 dropped to 6.0%, securing investment commitments of $1.7 trillion from countries like Europe, Japan, and South Korea. If reciprocal tariffs are deemed illegal, relevant achievements since Trump's second term might be nullified, giving him strong motivation to safeguard tariffs and maintain a tough image. On the other hand, under electoral pressure, initiating another round of tariff escalation might not align with Trump's electoral interests. Therefore, maintaining the current tariff structure is likely a priority for the Trump administration.
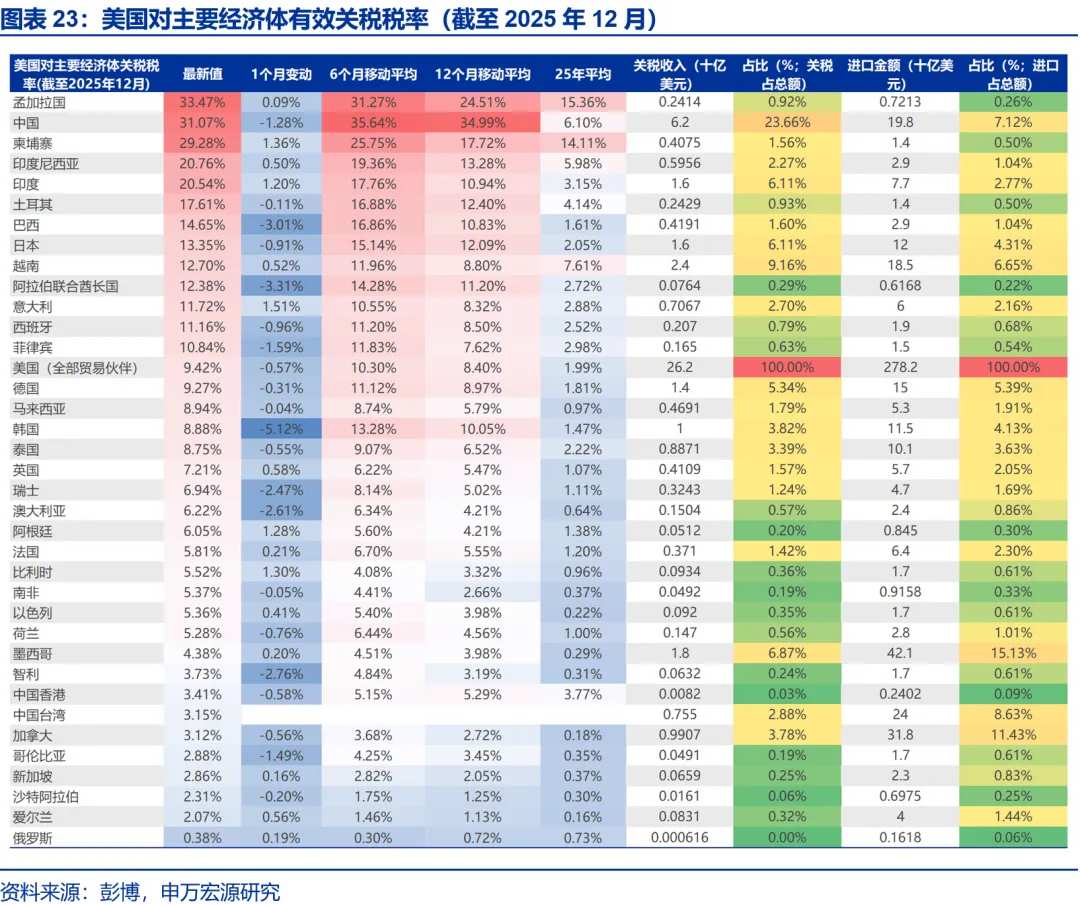
Without considering alternative measures under Section 122, the invalidation of reciprocal tariffs could reduce the effective U.S. tariff rate by 7-8 percentage points. Prior to the tariff ruling, the U.S. effective global tariff rate was 16.9%, including 31.07% for China, 22% for India, 14.9% for Japan, 21.6% for Vietnam, 13.6% for Italy, 13.7% for Germany, and 12.8% for South Korea. Following the invalidation of reciprocal tariffs, without additional measures, the U.S. effective tariff rate might drop to 9.1%, with rates for China possibly falling to 15.4%, India to 8.2%, Japan to 9.9%, Italy to 7.0%, Germany to 7.7%, and South Korea to 9.3%. Countries like China, Brazil, India, and Vietnam would benefit significantly.
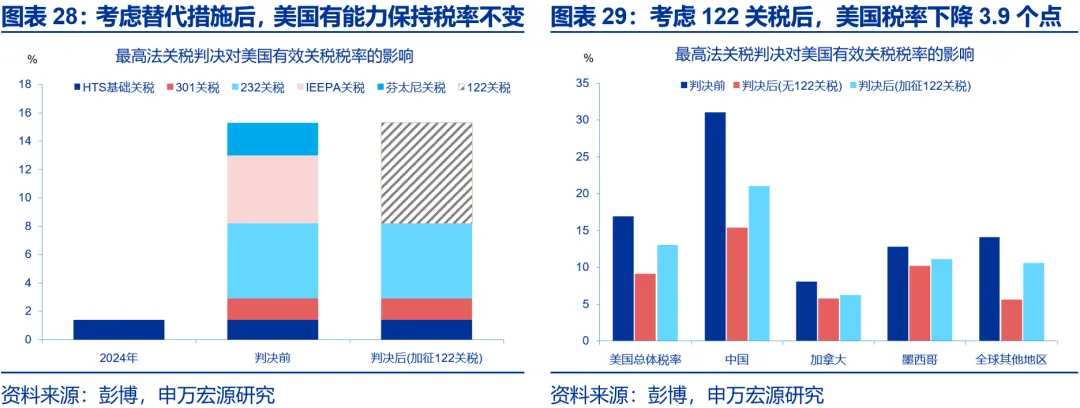
Considering alternative measures under Section 122, the U.S. tariff rate might only decrease by 3-4 percentage points. Following the invalidation of reciprocal tariffs, Trump immediately invoked Section 122, and at a 10% rate, the U.S. effective tariff rate might decline by 3.9 percentage points. However, after the expiration of Section 122, if relying on Sections 232 and 301 to fill the gap, the U.S. might need to expand Section 301 tariffs from China to multiple major trading partners and further broaden the scope of Section 232 tariffs.
(VI) Japan’s election concludes with the Liberal Democratic Party expanding its seats.
Key News: On February 18, Japan’s House of Representatives and House of Councillors held a prime ministerial nomination election, resulting in Sanae Takagi’s reappointment as Japan’s 105th prime minister.
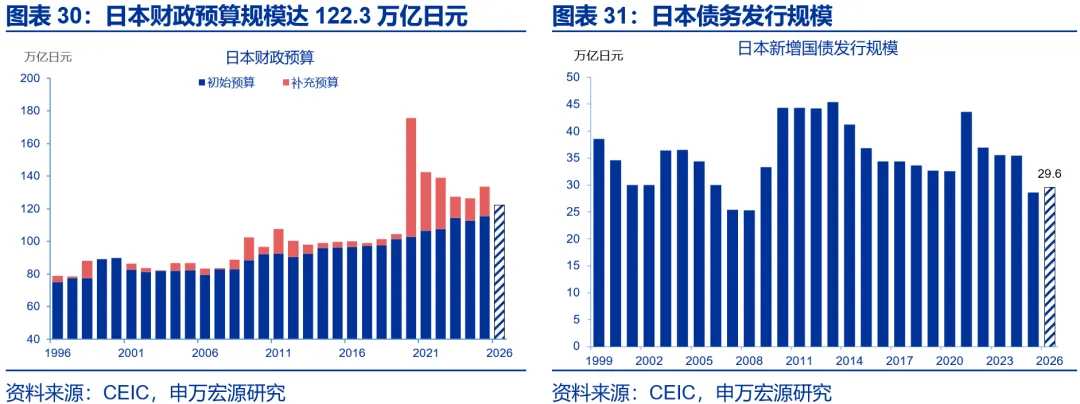
Japan’s election concluded with the Liberal Democratic Party expanding its seats. On January 23, Sanae Takagi dissolved the House of Representatives. On February 8, Japan held its 51st House of Representatives election, where the Liberal Democratic Party, led by Takagi, secured 316 seats, achieving a two-thirds majority independently, while the ruling coalition of the Liberal Democratic Party and Ishin no Kai obtained 352 seats. On February 18, Japan’s House of Representatives and House of Councillors held a prime ministerial nomination election, resulting in Takagi’s reappointment as Japan’s 105th prime minister.
Post-election, Japan’s macroeconomic policy direction remains one of expansionary fiscal policy, though the pace of implementation might become more cautious. The risk of debt spiraling out of control has somewhat eased. Following bond and currency shocks in late January, the Liberal Democratic Party adopted a more cautious tone regarding expansionary fiscal policy and a weak yen. To avoid market concerns, Takagi has downplayed her tax cut pledges. The priority post-election might be stabilizing debt risks; further expanding fiscal deficits could trigger greater market volatility, repeating the 2022 episode of UK Prime Minister Truss’s abrupt resignation.
Reducing food tax rates is a key commitment. Takagi pledged to suspend food taxes for two years. Given the strong vote-attracting nature of tax cuts, if the Liberal Democratic Party gains a significant advantage in the election, there may be greater flexibility in adjusting the magnitude and timing of tax reductions. Since February, to avoid market concerns, Takagi has softened her tax cut commitments during the campaign. Post-election, the Liberal Democratic Party may adopt a milder alternative tax reduction plan. Long-term interest rates still trend upward, but with the Liberal Democratic Party’s expanded advantage, the necessity for competitive expansionary fiscal policies to secure votes diminishes, alleviating short-term concerns about disorderly interest rate increases.
(VII) U.S.-Iran negotiations reach an impasse, with the U.S. issuing an ultimatum.
Key News: From February 17 to 18, 2026, the United States and Iran held the second round of negotiations in Geneva, Switzerland. No consensus was reached between the two parties.
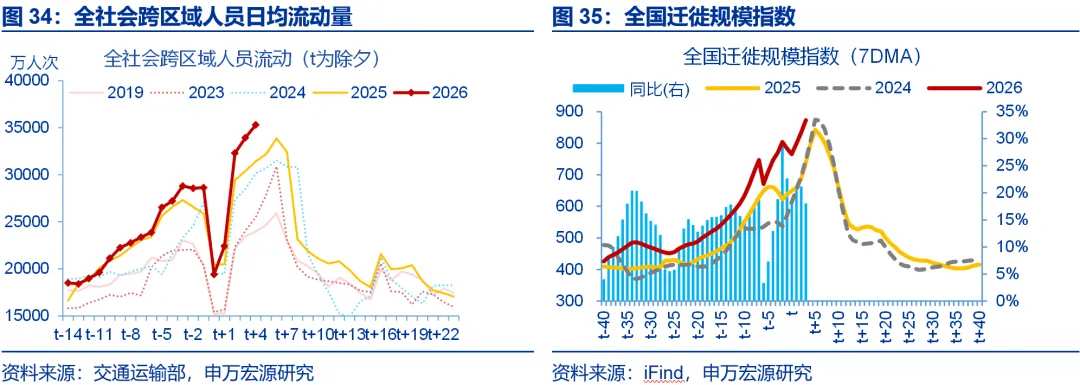
The US-Iran negotiations have reached a deadlock, with the US issuing an ultimatum. On February 6, the first round of negotiations between the US and Iran took place in Oman. This marked the first formal diplomatic contact since the conflict in June 2025, and on the same day, the US announced a new round of sanctions against Iran. On February 10, Trump stated that he would not rule out sending a second aircraft carrier to the Middle East to enhance US military readiness. On February 11, Trump reiterated that negotiation and reaching an agreement remained the top priority. From February 17 to 18, the US and Iran held a second round of indirect talks in Switzerland. The two sides only managed to reach minimal consensus on procedural 'guiding principles,' with significant differences remaining on core issues. Iran demanded the complete lifting of all sanctions, while the US insisted that Iran abandon its high-enrichment uranium activities and limit ballistic missile development, demanding that Iran fulfill its obligations first. On February 19, Trump stated that if no 'meaningful agreement' could be reached within 10-15 days, the US would take 'further military action.' Iran responded by stating it would launch a 'legitimate and unlimited counterattack' if attacked. Going forward, geopolitical risks between the US and Iran may continue to rise.
III. Domestic Data and Events: Travel intensity during the Spring Festival holiday continued to rise, with both traditional and specialty tourism experiencing increased demand.
During the Spring Festival holiday, travel intensity continued to increase. Structurally, there was a rebound in the popularity of both traditional and specialty tourism. By comparison, film consumption weakened, with declines in both the number of moviegoers and average ticket prices.
(1) Travel intensity during the Spring Festival holiday continued to rise, with both traditional and specialty tourism experiencing increased demand.
Key News: During the first six days of the 2026 Spring Festival holiday, the total inter-regional passenger flow across society reached 1.72 billion trips, with an average daily flow rate increasing by 4.6% year-on-year, up 0.9 percentage points compared to the Spring Festival travel rush period.
Data Source: Ministry of Transport
Summary:
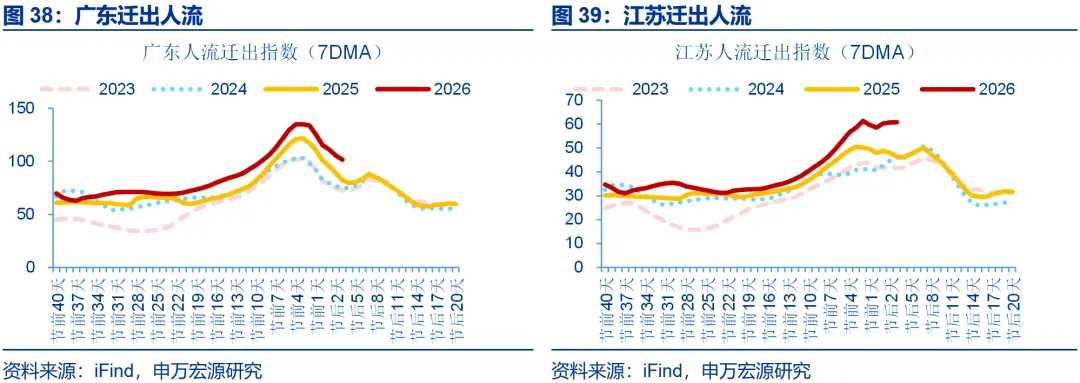
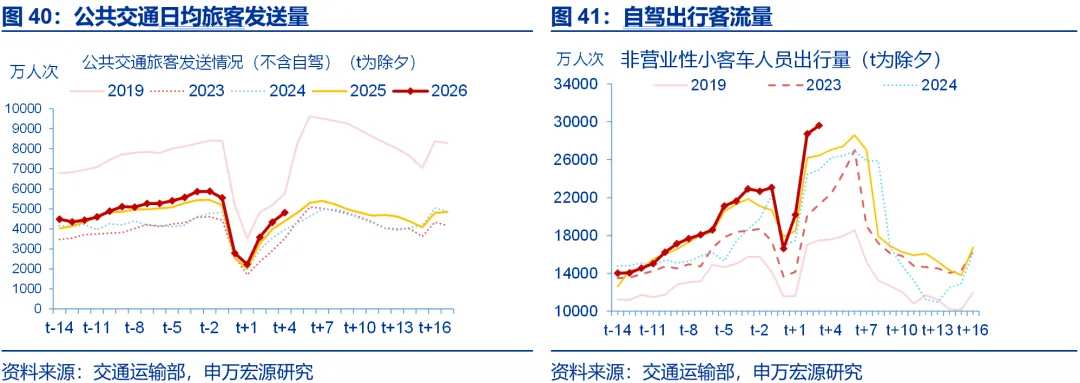
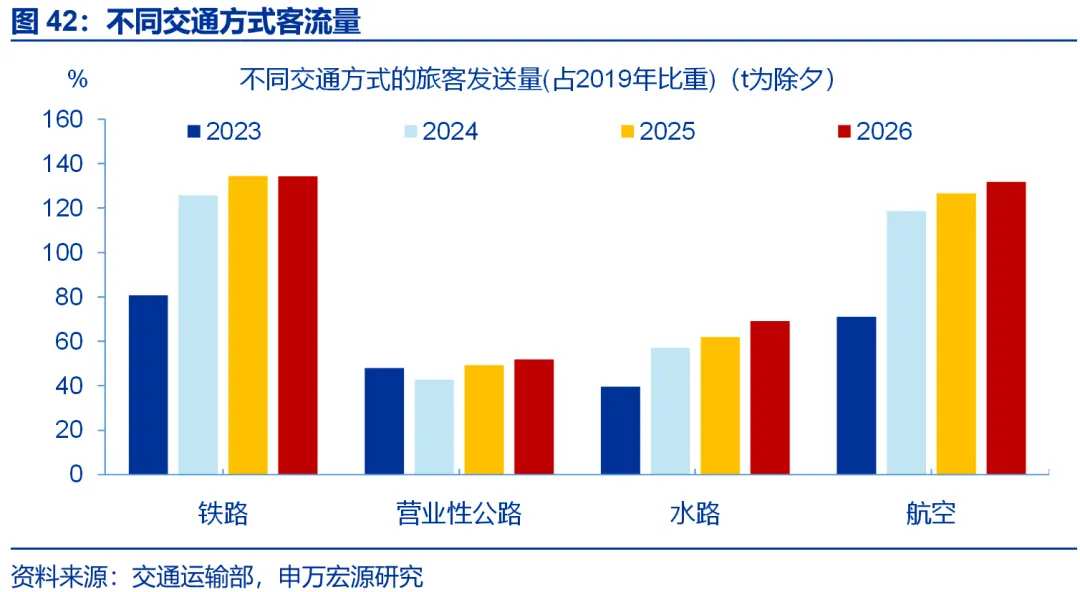
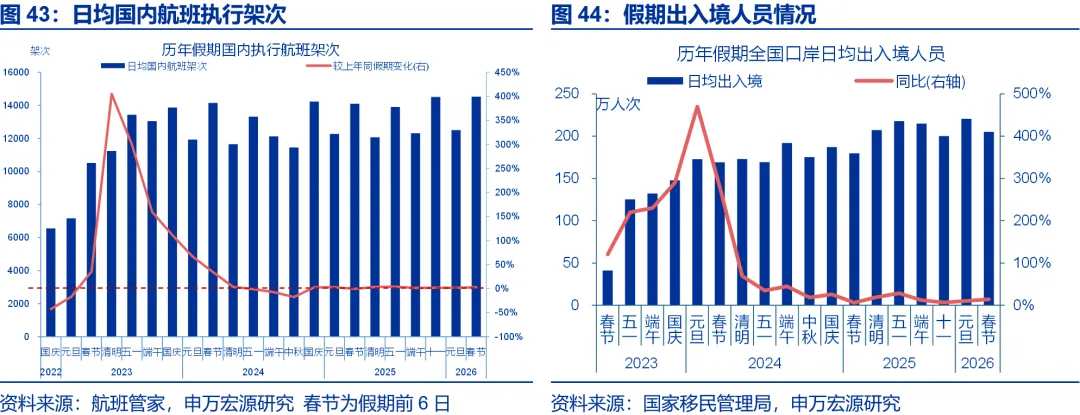
Feature One: During the 2026 Spring Festival travel rush, the rhythm of passenger flow was delayed, concentrated mainly in the three days before Lunar New Year's Eve. After the start of the 2026 Spring Festival travel season, the inter-regional passenger flow across society remained around 1.5% year-on-year. However, in the three days before Lunar New Year's Eve (from the 26th to the 28th day of the 12th lunar month), passenger intensity significantly increased, reaching a short-term peak (up 6% year-on-year), indicating a more concentrated return-home passenger flow. In terms of specific modes of transportation, public transport reflecting long-distance travel saw daily average passenger volumes (including commercial road, rail, waterway, and air transport) increase by 5.2% year-on-year. Unlike previous years when rail passenger intensity was higher, the intensity of road and civil aviation passenger traffic was relatively high during the 2026 Spring Festival travel period, with increases of 6.1% and 4.4% respectively, whereas railway passenger volume grew by only 2.7%. Additionally, self-driving travel intensity was relatively low, with daily average passenger flow increasing by only 3.3% year-on-year.
The characteristics of passenger flow in typical regions also corroborate this trend: inbound migration intensity in labor-exporting provinces and outbound migration intensity in labor-importing provinces peaked during the three days before Lunar New Year’s Eve. Regarding the direction of passenger flow in typical regions, the inbound migration intensity of major labor-exporting provinces such as Hubei and Guizhou surged from 1% and 2% one week before Lunar New Year’s Eve to 36.1% and 14.2%, respectively, in the three days prior. Correspondingly, outbound migration intensity from labor-importing provinces like Guangdong and Jiangsu also rose from around 4% and 5% one week before Lunar New Year’s Eve to 18.5% and 21.3%, respectively, in the three days before.
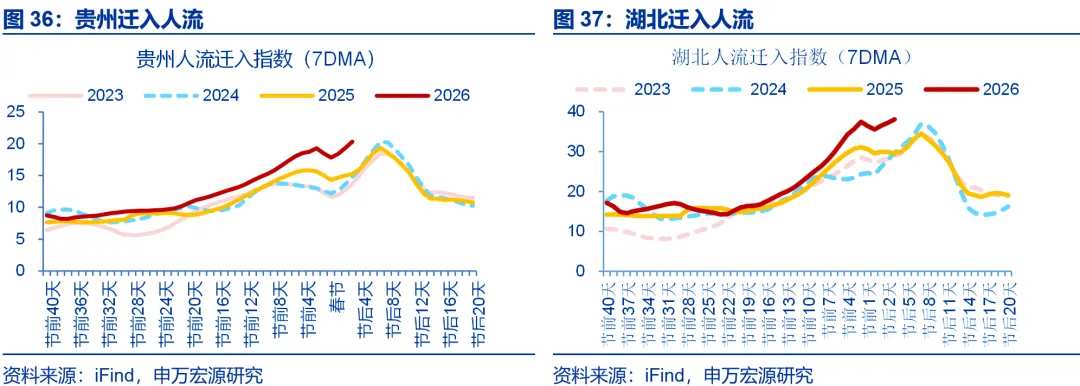
Feature Two: After the third day of the Spring Festival holiday, passenger flow intensity further increased, likely pointing to robust release of travel demand during the holiday. During the first six days of the Spring Festival holiday (February 15 to February 20), the average daily passenger flow increased by 0.9 percentage points from the Spring Festival travel rush period to 4.6% year-on-year. In terms of timing, passenger flow intensity increased after the third day of the Spring Festival holiday (February 17, the first day of the Lunar New Year), with the year-on-year growth rising from -5% to 12.3%, primarily driven by a rebound in self-driving travel passengers (year-on-year growth moving from -7.1% to 12%). Daily average passenger volumes for public transport also increased, growing by 5.8 percentage points from the Spring Festival travel period to 11% year-on-year. Notably, commercial road passenger volumes experienced significant growth, up 7.7 percentage points to 13.7% year-on-year, while daily average railway and air transport passenger volumes rebounded by 3.2 and 1.6 percentage points to 5.9% and 6.1%, respectively.
Characteristic Three: In terms of flight execution, the number of domestic flights continued to rise while cross-border travel activity showed a decline. Domestic flight executions increased, with the number of flights during the first six days of the Spring Festival holiday rising by 3% year-on-year and increasing by one percentage point compared to the October 2025 holiday. In contrast, cross-border travel activity declined. The National Immigration Administration predicted that the average daily number of border crossings at national ports during the 2025 Spring Festival holiday would reach 2.05 million people, a 7% decrease from the New Year's Day holiday. During the first six days of the holiday, international flight executions rose by 1.3% year-on-year but fell by 9.1 percentage points compared to the October 2025 holiday. Notably, outbound travel activity dropped significantly; flights from China to Japan and Cambodia decreased by 70.4 and 50 percentage points year-on-year, respectively, reaching -47.7% and -10%. Inbound tourism remained strong; data from Qunar showed that on the first day of the Spring Festival holiday (February 15), the number of domestic flight bookings made with non-Chinese passports increased by nearly 20% year-on-year.
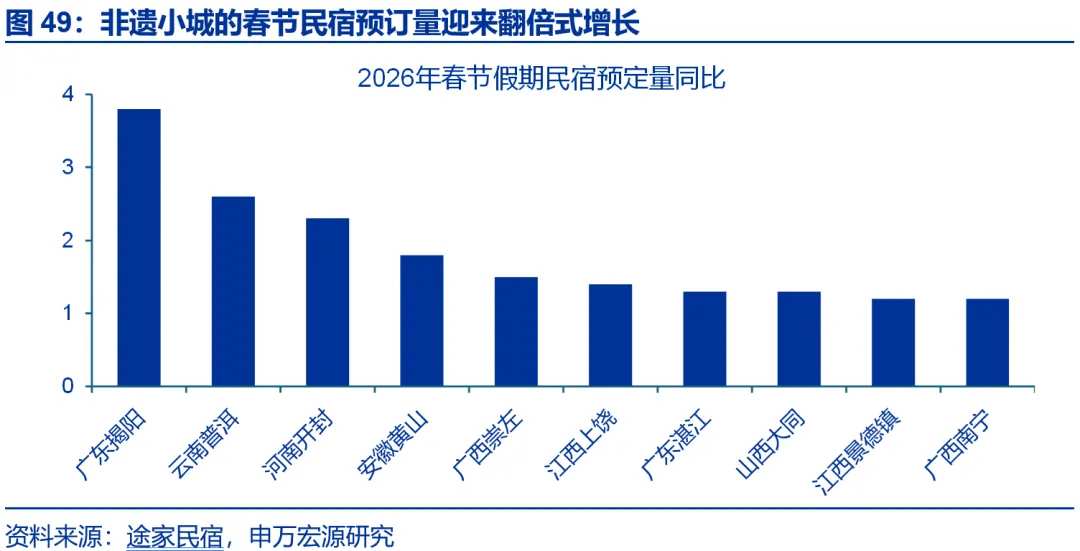
Characteristic Four: In terms of tourist destinations, traditional scenic spots saw a recovery in popularity during the holiday, while distinctive forms of tourism such as 'intangible cultural heritage tours' performed notably well. During the first four days of the holiday, the average daily sales revenue of key retail and catering enterprises nationwide increased by 8.6% year-on-year, up by 5.9 percentage points compared to the October 2025 holiday. UnionPay and NetUnion transaction volumes reached 9.78 trillion yuan, a 15.0% year-on-year increase. In terms of travel destinations, traditional scenic spots regained popularity; for instance, A-level scenic spots in Sichuan Province (from the first to fifth day) received 10.2% more visitors year-on-year, an increase of 1.9 percentage points over the October 2025 holiday. Ticket revenues, however, declined (falling by 14.9 percentage points year-on-year to -8.3%), which is related to policies like ticket discounts and consumption vouchers introduced across various regions. Driven by emotional consumer demand, Spring Festival travel demonstrated a shift from sightseeing to immersive cultural experiences, with cities known for intangible cultural heritage, such as Jieyang in Guangdong (3.8 times), Pu'er in Yunnan (2.6 times), and Kaifeng in Henan (2.3 times), seeing their Spring Festival homestay bookings grow exponentially.
Characteristic Five: Prices remained generally stable, with pre-sale prices of hotels and air tickets increasing compared to the same period last year. As of February 11, the average pre-sale price of air tickets (net fare) during the Spring Festival travel season was 908 yuan, higher than last year’s average of 884 yuan and the October 2025 holiday average of 804 yuan. Regarding accommodations, as of February 14, hotel and homestay booking rates for the Spring Festival holiday were 37.9% and 37.6%, respectively, with hotel bookings rising by 0.8 percentage points compared to the October holiday, while homestays declined by 0.9 percentage points. In terms of pricing, hotel room rates increased by 5.4% year-on-year, while homestay prices remained flat compared to the previous year.
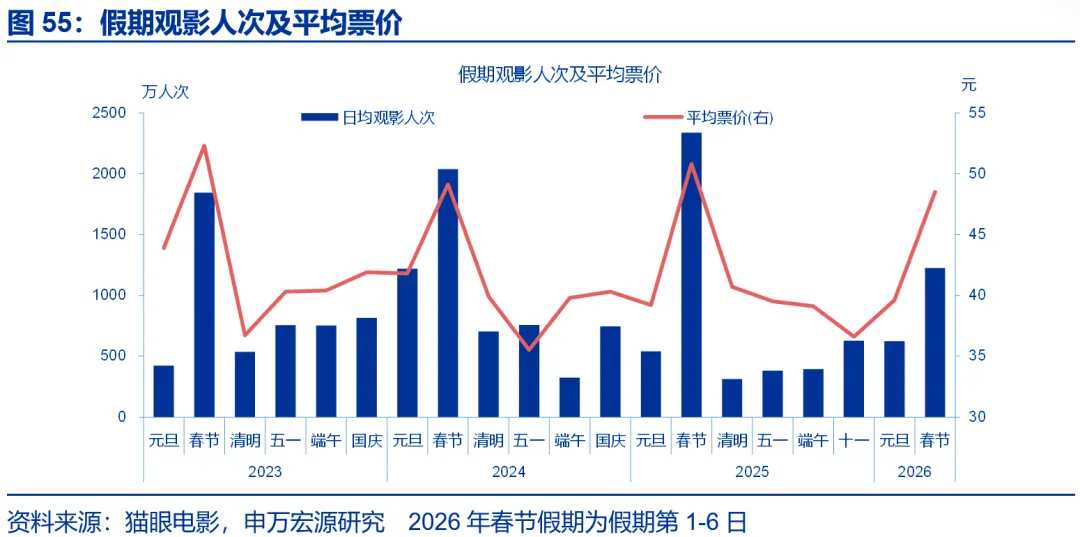
Characteristic Six: The film market weakened compared to the October holiday, with both volume and price performance declining. During the first six days of the holiday, the nationwide box office revenue of cinemas decreased by 23.9 percentage points year-on-year compared to the October 2025 holiday, reaching -47.6%. Breaking it down into volume and price, the average ticket price during the Spring Festival holiday fell by 4.5% year-on-year, declining by 12.7 percentage points compared to the October holiday, and the number of moviegoers dropped by 47.5% year-on-year, falling by 31.6 percentage points compared to the October holiday. Movie consumption weakened across cities of different tiers, with box office revenue in first-tier and second-tier cities falling by 16.1 and 25 percentage points year-on-year compared to the October holiday, reaching -49.4% and -51.7%, respectively.
(2) Weak real estate transactions, with significant declines in first-tier cities
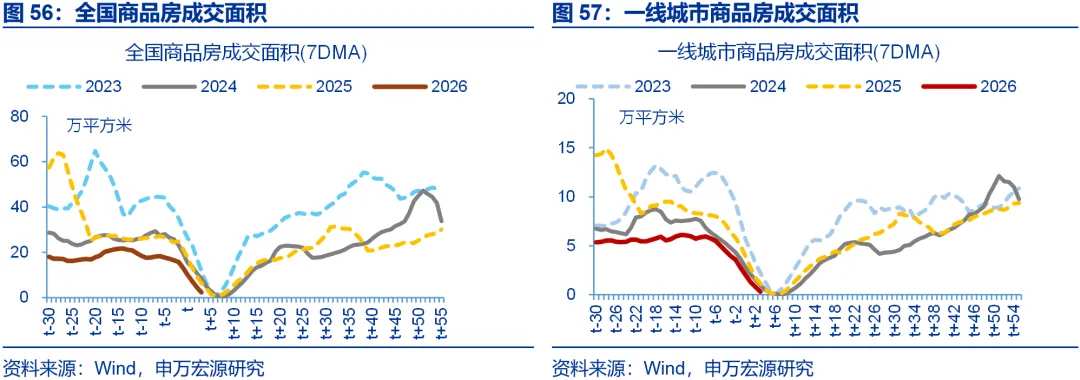
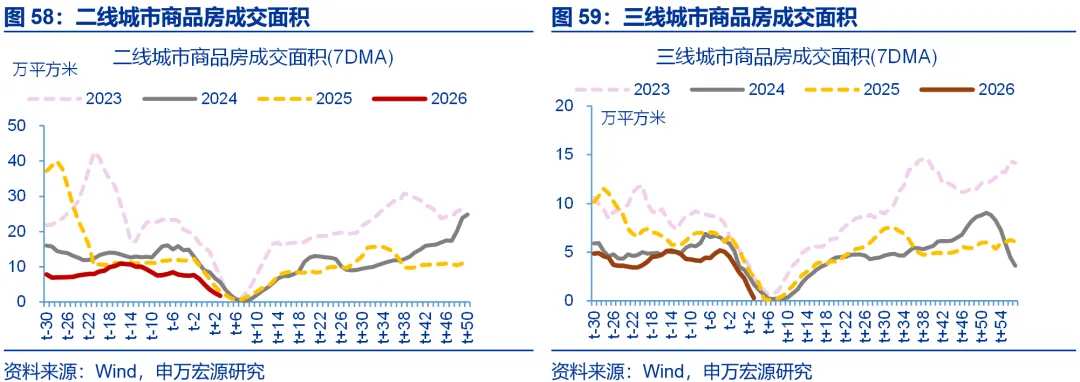
Key News: From the first to sixth days of the Spring Festival holiday (February 15 to February 20), the total residential property transaction area in 30 major and medium-sized cities amounted to 1.02 million square meters, with average daily transaction area decreasing by 43% year-on-year.
Data Source: Wind
Summary:
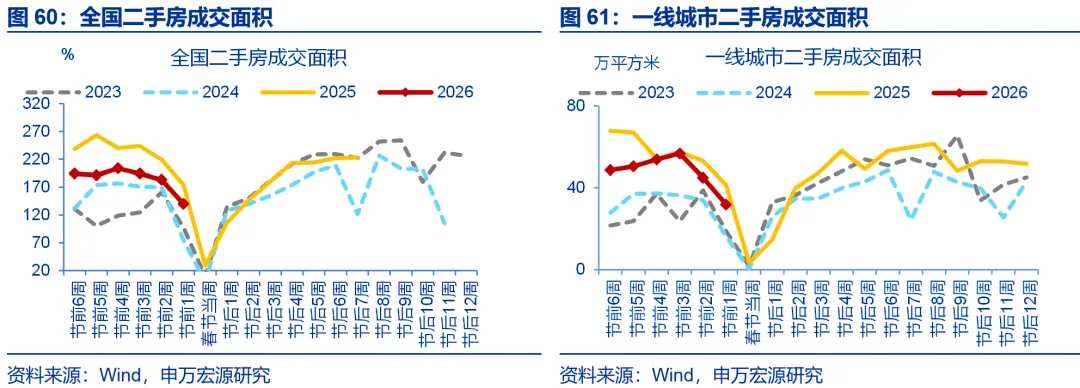
During the Spring Festival holiday, new home and second-hand property transactions nationwide were weak, with particularly large declines in first-tier cities. From the first to sixth days of the holiday (February 15 to February 20), the total residential property transaction area in 30 major and medium-sized cities amounted to 1.02 million square meters, a year-on-year decrease of 43% and a drop of 10.6 percentage points compared to the week before the holiday. Structurally, the residential property transaction area in first-tier cities experienced a larger decline, with year-on-year figures dropping by 14.7 percentage points to -46.8% compared to the week before the holiday. Second-tier and third-tier cities saw relatively smaller declines, with year-on-year decreases of 7.4 and 12.5 percentage points to -40% and -45.2%, respectively. Nationwide second-hand property transaction areas also declined, with year-on-year figures falling by 3.6 percentage points to -20% compared to two weeks before the holiday. Among them, the second-hand property transaction area in first-tier cities decreased by 7.6 percentage points to -22.8% year-on-year.
(3) Overall improvement in industrial production, with mixed performance in construction starts
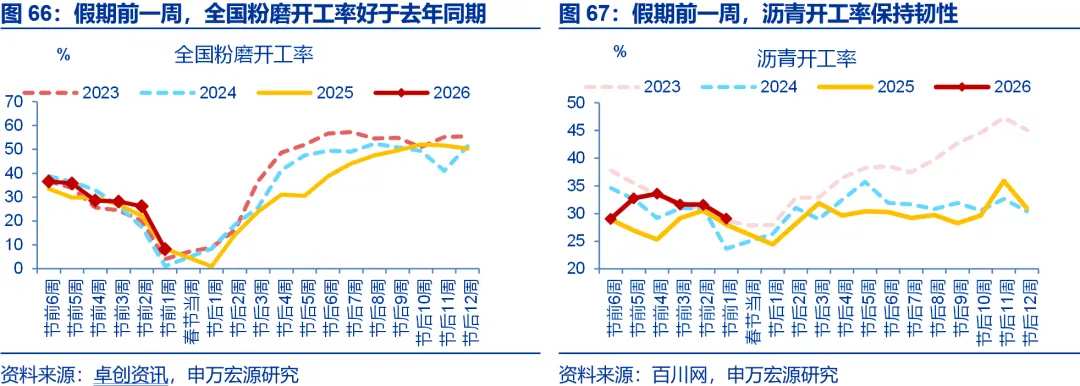
Key News: As of the week before the Spring Festival holiday (February 9 to February 15), industrial production in metallurgical and petrochemical chains improved. Construction starts showed mixed performance, with grinding start rates reflecting real estate investment declining, while asphalt start rates reflecting infrastructure investment maintained resilience.
Data Source: Wind
Summary:
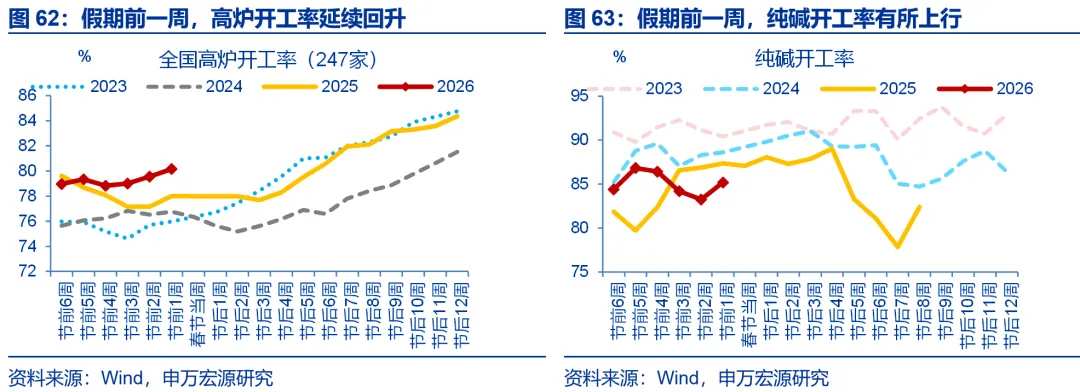
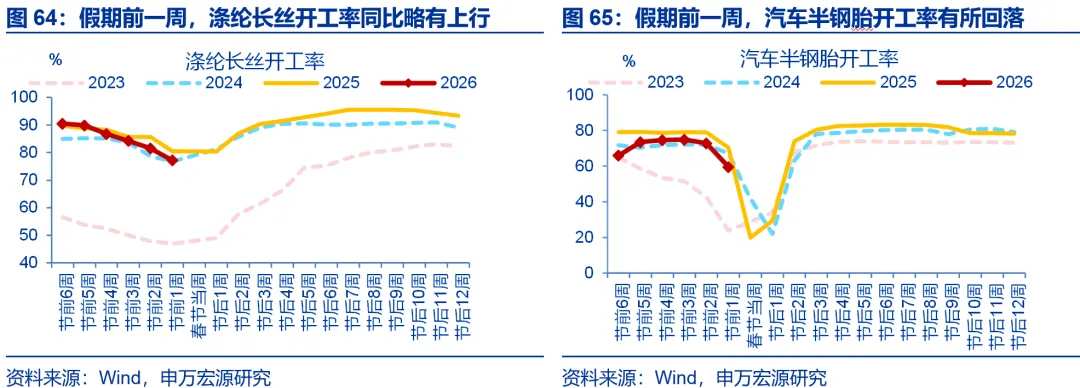
Before the Spring Festival holiday, overall industrial production showed positive momentum, while construction sector activity demonstrated mixed performance. In the week prior to the Spring Festival holiday (February 9 to February 15), industrial production saw a continued rise in blast furnace operations (up 0.6% week-over-week) with year-over-year growth maintained at 2.2%. Petrochemical chain operations also improved, with soda ash and polyester filament operations rebounding by 1.5 and 0.9 percentage points respectively from the previous week to -2.2% and -3.3% year-over-year. By contrast, the utilization rate of semi-steel radial tires in the automobile sector was weaker, falling by 4.8 percentage points year-over-year to -10.9%. Regarding construction sector activity, the national cement grinding start rate, which more directly reflects real estate investment, weakened somewhat, declining by 4.2 percentage points year-over-year to -0.1%. Asphalt operation rates remained resilient, staying at 1.1% year-over-year.
(4) In January, inflation diverged, driven by the misalignment of the Spring Festival, imported factors boosting prices, and persistently weak demand.
Key News: On February 11, the National Bureau of Statistics released January’s inflation data: CPI year-over-year 0.2%, previous value 0.8%, forecast 0.4%, month-over-month 0.2%; PPI year-over-year -1.4%, previous value -1.9%, forecast -1.5%, month-over-month 0.4%.
Data Source: National Bureau of Statistics
Summary:
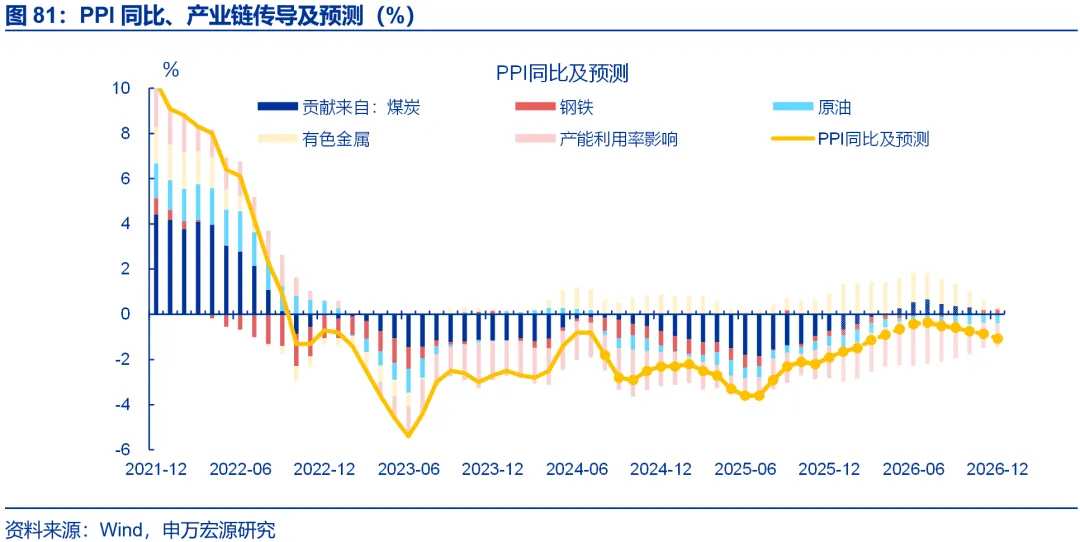
The decline in January’s PPI narrowed significantly, primarily due to copper prices further driving up the PPI, with some impact also from base period rotation. The month-on-month PPI for January was 0.4%, while year-over-year it rose by 0.5 percentage points to -1.4%. China's price indices undergo a base period rotation every five years, with the next adjustment cycle beginning in 2026. It is estimated that this base period rotation had an average monthly impact of approximately 0.08 percentage points on the year-over-year PPI, which is relatively small. More importantly, the increase in copper prices expanded further in January (up 9.3% month-over-month), with non-ferrous metal mining and processing prices rising by 5.7% and 5.2% month-over-month respectively, contributing to a 0.5% month-over-month rise in the PPI, making it the strongest contributing factor. Steel prices also contributed positively to the PPI, driving a 0.1% month-over-month increase.
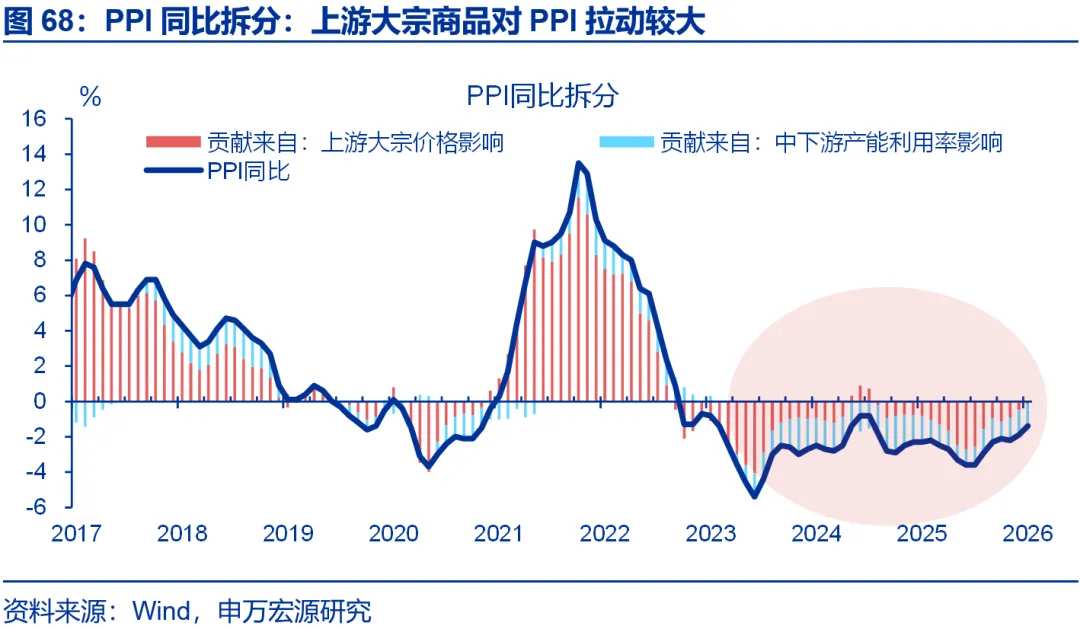
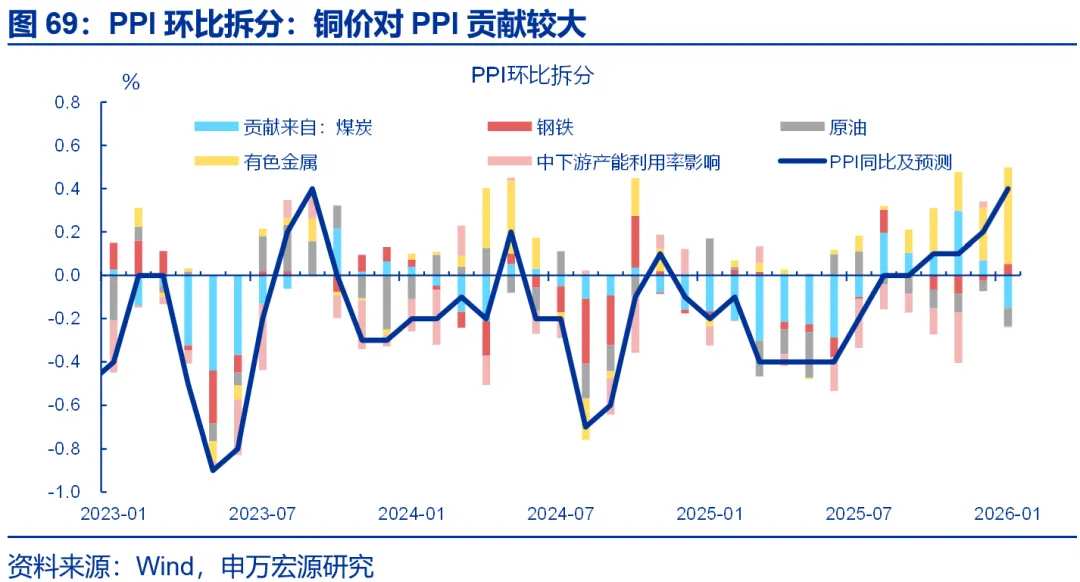
In contrast, prices of commodities such as coal and oil, along with mid- and downstream PPIs, were relatively weak. Declining international crude oil prices led to a 3.1% drop in domestic petroleum extraction and a 2.5% decrease in refined petroleum product manufacturing prices, dragging down the PPI by -0.08% month-over-month. Coal prices also weakened, resulting in a drag of -0.15% month-over-month on the PPI. The capacity utilization rate in mid- and downstream industries did not show significant improvement, limiting the upstream price increases' pull on mid- and downstream sectors. Estimates indicate that mid- and downstream sectors only contributed a 0.1% month-over-month increase to the PPI. Specifically, the PPIs for alcohol and beverage and pharmaceutical industries fell by -1.4% and -0.9% month-over-month respectively.
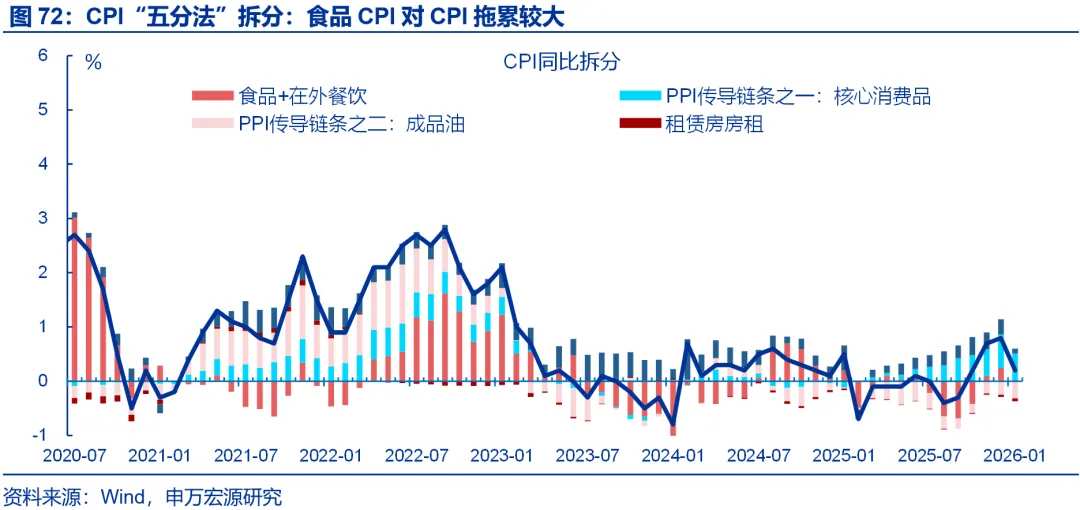
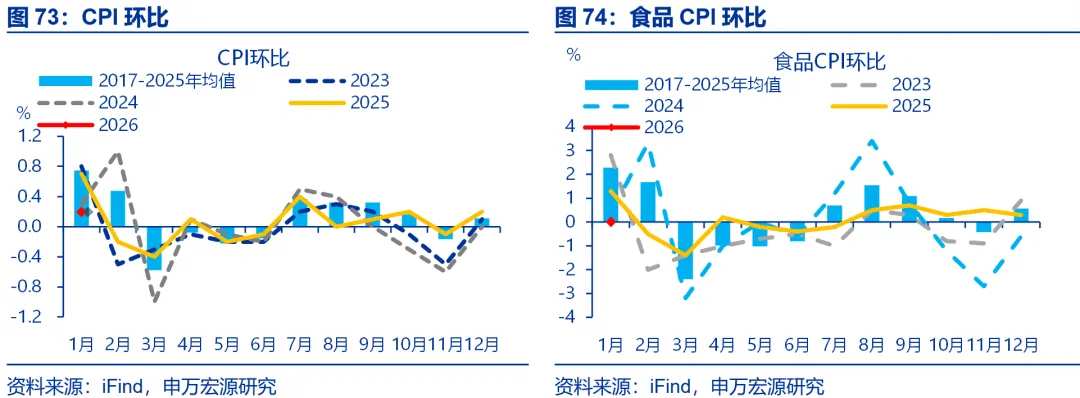
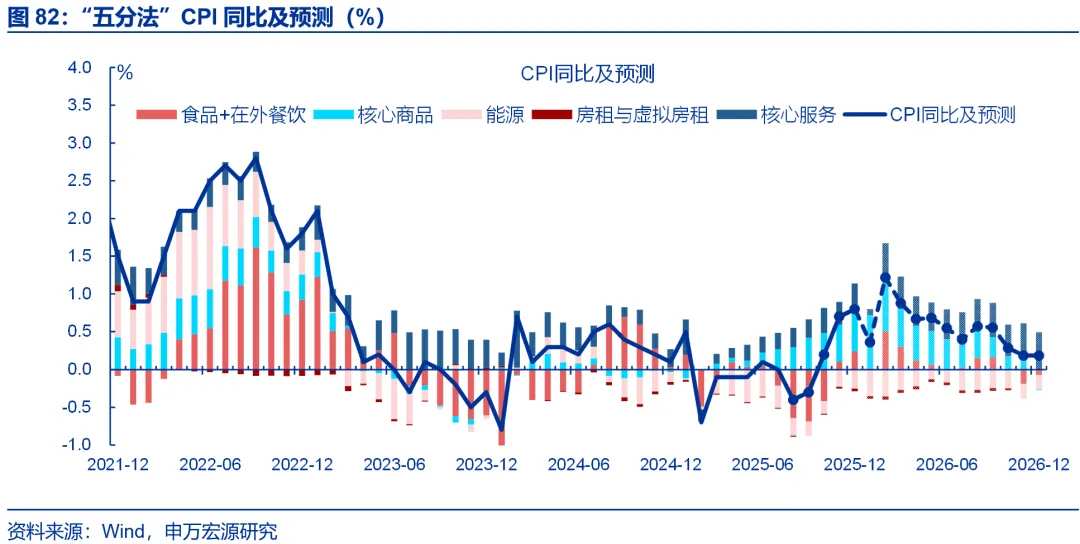
Due to the misalignment of the Spring Festival, the year-over-year CPI for January declined significantly; however, after excluding this factor, the overall CPI remained weak. According to calculations by the National Bureau of Statistics, the recent base period rotation added 0.06 percentage points to the monthly year-over-year CPI. The misalignment of the Spring Festival in 2026 compared to 2025 caused the January CPI to fall by 0.6 percentage points from the previous month to 0.2% under the influence of a high base. Moreover, the month-over-month CPI for January was only 0.2%, significantly lower than the typical pre-Spring Festival month CPI performance (0.6%), reflecting the overall weakness in CPI. Structurally, food CPI fell sharply, declining by 1.8 percentage points from the previous month to -0.7% year-over-year. Specifically, fresh vegetable and fruit CPIs fell by 11.3 and 1.2 percentage points respectively to 6.9% and 3.2%. Pork prices remained low at -13.7% year-over-year, affected by previously high inventories.
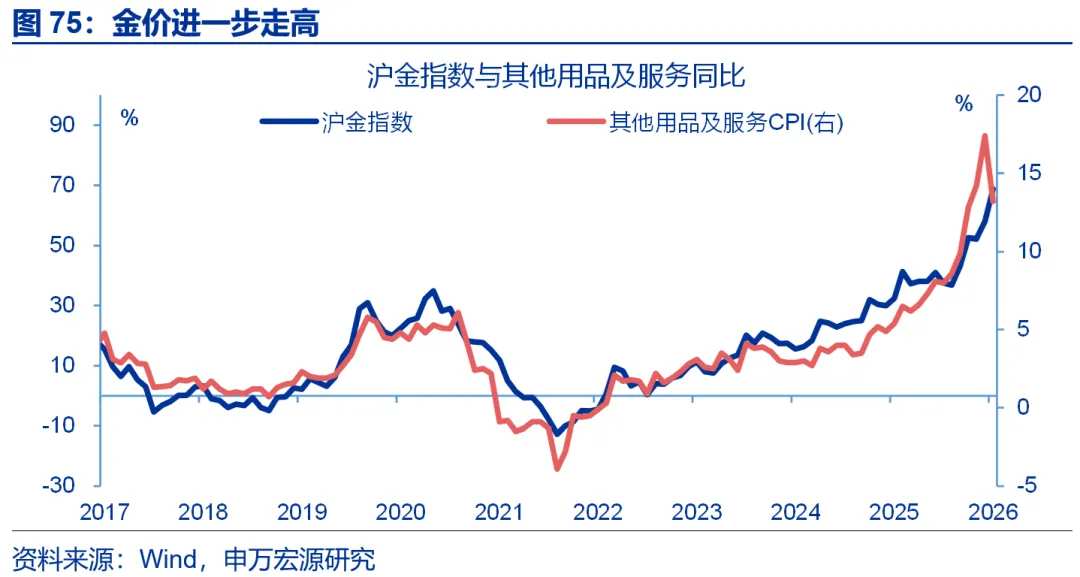
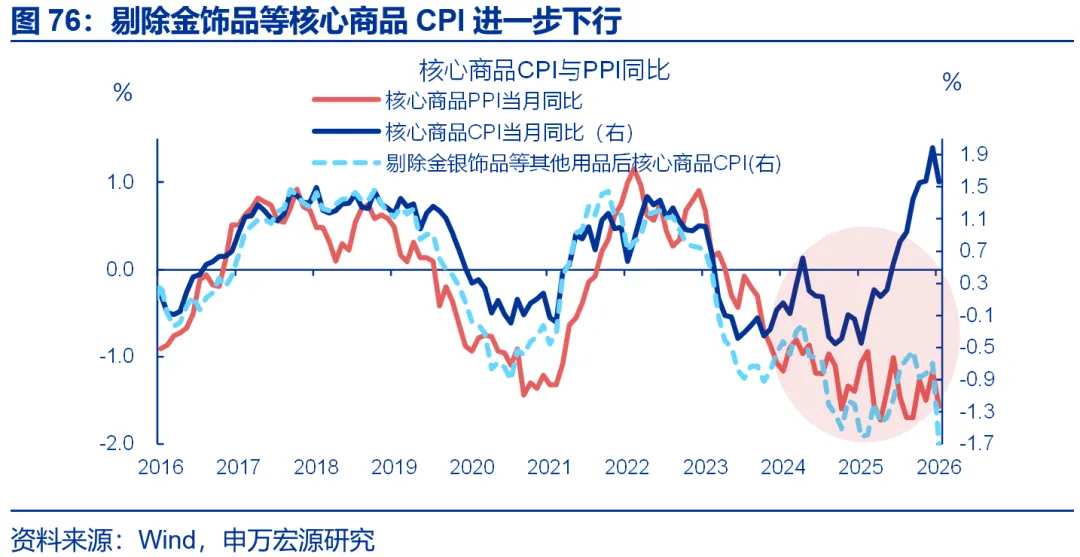
Excluding the impact of gold prices, core goods CPI was also relatively weak. Year-over-year core goods CPI fell by 0.4 percentage points to 1.6% in January. Breaking it down, gold prices rose year-over-year to 68.7% in January, driving the year-over-year increase in gold jewelry prices to expand further to 77.4%. Excluding gold jewelry, other core goods CPI dropped significantly, falling by 1 percentage point from the previous month to -1.7%. Structurally, home appliance CPI strengthened further, likely reflecting supply-side influences related to rising raw material costs like copper and anti-internal competition dynamics, though prices in other sectors remained weak.
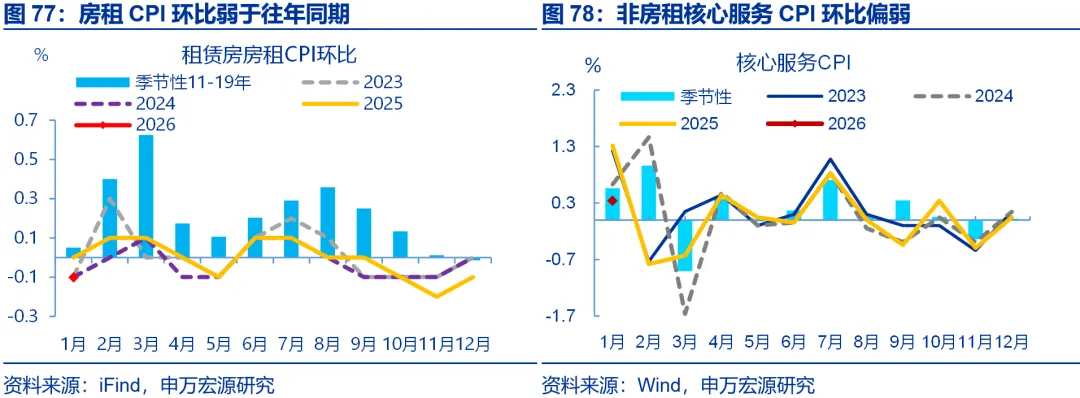
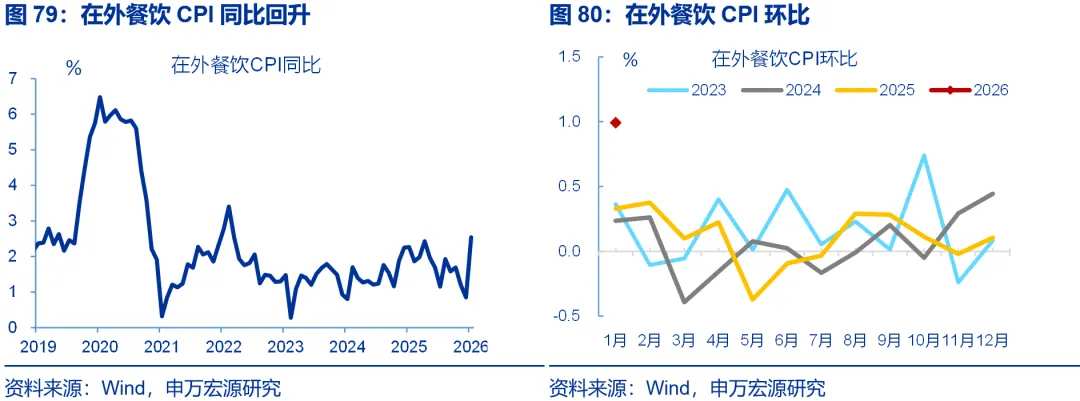
After adjusting for the Spring Festival misalignment, service CPI was also weaker than in previous pre-Spring Festival months, potentially due to an earlier “returning home wave.” Influenced by the Spring Festival misalignment, year-over-year service CPI fell by 0.5 percentage points to 0.1% in January. Breaking it down, the largest component of service CPI is the imputed rent CPI, which is highly sensitive to rental demand. Currently weak rental demand caused the rent CPI to continue its decline in January (down 0.1 percentage points to -0.4% year-over-year). Core services CPI was also weak, rising only 0.3% month-over-month, below the typical pre-Spring Festival month performance of service CPI (0.6%). However, dining-out CPI within food and tobacco categories improved, increasing by 1.7 percentage points year-over-year to 2.5%.
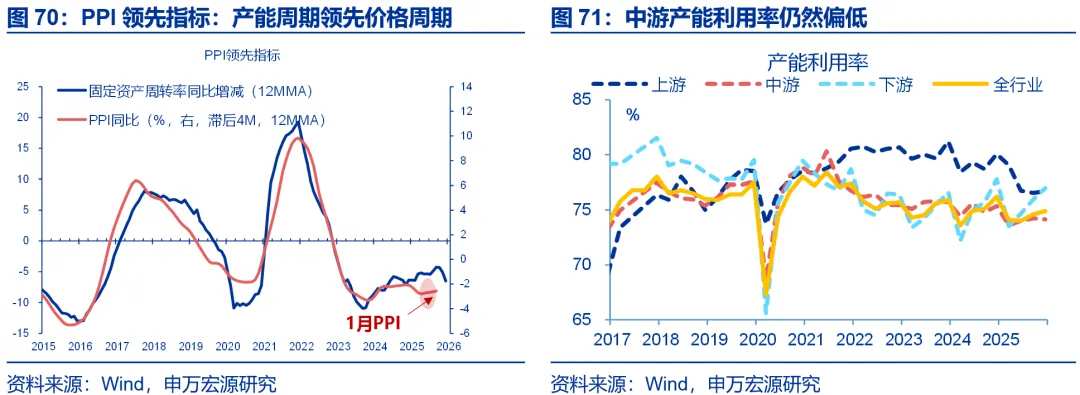
Looking ahead: Compared to the impact of upstream price increases, the performance of prices in the mid- and downstream sectors is more critical. We continue to track the policy effects aimed at countering internal competition in these sectors. Over the past three years, fluctuations in commodity prices have only explained about 30% of PPI changes, with PPI being more influenced by excessive price declines caused by internal competition in the mid- and downstream sectors. Even if there is a possibility of continued upward movement in commodity prices, the transmission of upstream price pressures to downstream sectors may be obstructed, potentially limiting the extent of a PPI rebound. We maintain our view of a weak recovery in PPI. Regarding CPI, the shift in the timing of the Spring Festival has lowered the base for February, while high gold prices and improvements in service consumption could drive a noticeable rebound in CPI, possibly resulting in a 'V-shaped' trend at the beginning of the year.
(5) The central bank releases financial data for January 2026
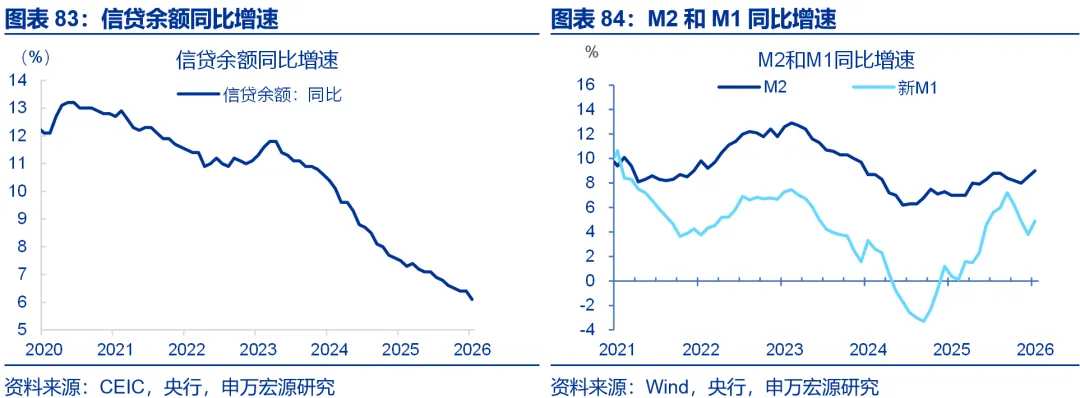
On February 13, 2026, the central bank released its financial statistics report for January 2026, showing an increase of 4.71 trillion yuan in renminbi loans in January. By sector, household loans increased by 456.5 billion yuan, including an increase of 109.7 billion yuan in short-term loans and 346.9 billion yuan in medium- to long-term loans; loans to enterprises and institutions increased by 4.45 trillion yuan, including an increase of 2.05 trillion yuan in short-term loans, 3.18 trillion yuan in medium- to long-term loans, and a decrease of 873.9 billion yuan in bill financing; loans to non-banking financial institutions decreased by 188.2 billion yuan.
Preliminary statistics indicate that the increment in aggregate financing in January 2026 was 7.22 trillion yuan, 166.2 billion yuan more than the same period last year. Of this, renminbi loans issued to the real economy increased by 4.9 trillion yuan, a year-on-year decrease of 317.8 billion yuan; foreign currency loans converted into renminbi increased by 46.8 billion yuan, a year-on-year increase of 86 billion yuan; entrusted loans decreased by 19.2 billion yuan, a year-on-year reduction of 64.1 billion yuan; trust loans decreased by 400 million yuan, a year-on-year reduction of 62.7 billion yuan; undiscouted bankers' acceptances increased by 629.3 billion yuan, a year-on-year increase of 163.9 billion yuan; net corporate bond financing amounted to 503.3 billion yuan, a year-on-year increase of 57.9 billion yuan; net government bond financing reached 976.4 billion yuan, a year-on-year increase of 283.1 billion yuan; domestic stock financing by non-financial enterprises amounted to 29.1 billion yuan, a year-on-year decrease of 18.2 billion yuan.
At the end of January, the broad money supply (M2) balance was 347.19 trillion yuan, growing 9% year-on-year. The narrow money supply (M1) balance was 117.97 trillion yuan, increasing 4.9% year-on-year. The cash in circulation (M0) balance was 14.61 trillion yuan, rising 2.7% year-on-year. In January, there was a net cash injection of 519.1 billion yuan. Renminbi deposits increased by 8.09 trillion yuan in January. Of this, household deposits rose by 2.13 trillion yuan, non-financial enterprise deposits increased by 2.61 trillion yuan, fiscal deposits grew by 1.55 trillion yuan, and deposits by non-banking financial institutions increased by 1.45 trillion yuan.
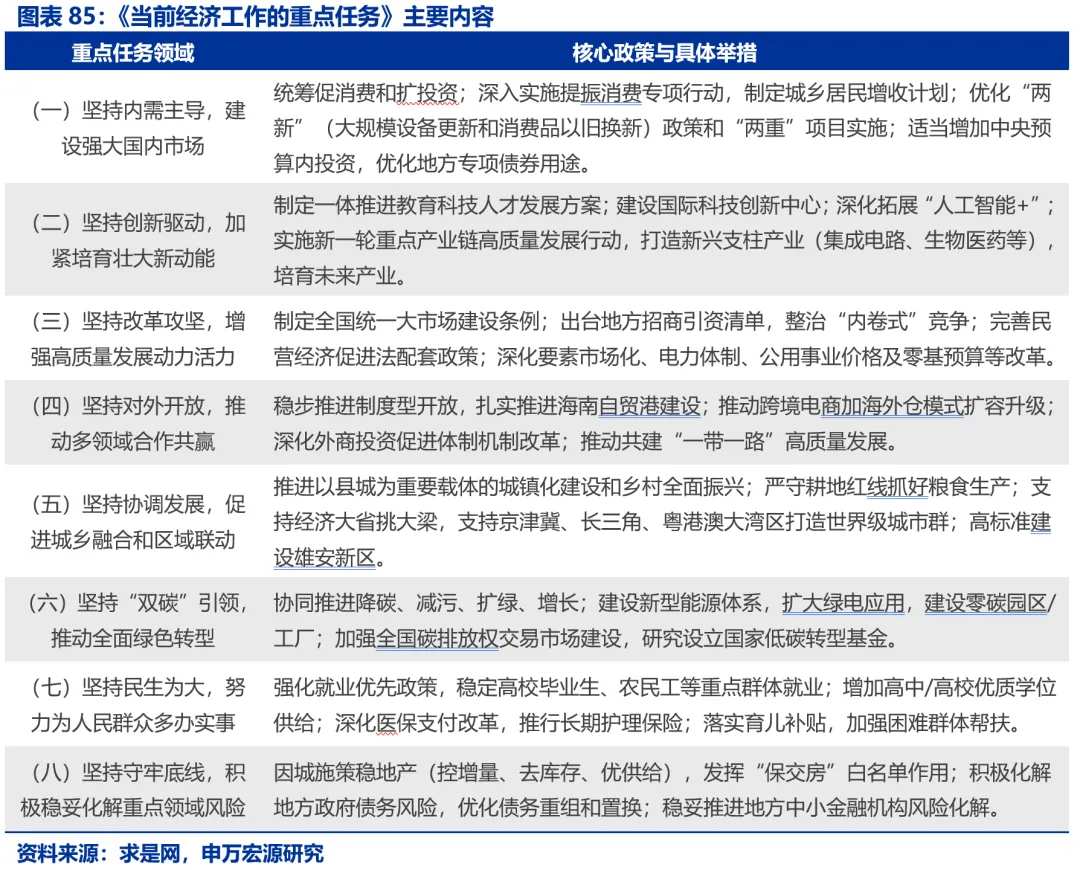
(6) Qiushi publishes key article 'Current Priorities for Economic Work'
On February 15, Qiushi magazine published an important article by the General Secretary titled 'Current Priorities for Economic Work.' The article emphasized the need to adhere to domestic demand leadership, vigorously implement actions to boost consumption, and expand the supply of high-quality goods and services; it also called for innovation-driven development, using technological advancement to lead industrial upgrades and continuously fostering new productive forces. The current economic work includes systematic arrangements to promote consumption, expand investment, nurture new growth drivers, and address risks in key areas, further strengthening the intrinsic motivation and resilience for high-quality development. This deployment of key tasks precisely shifts policy focus towards increasing urban and rural residents’ income and optimizing policies related to 'two new areas,' significantly deepening and expanding 'artificial intelligence+' and strategic emerging industries, fully stimulating the vitality of various business entities, and advancing the construction of a unified national market.
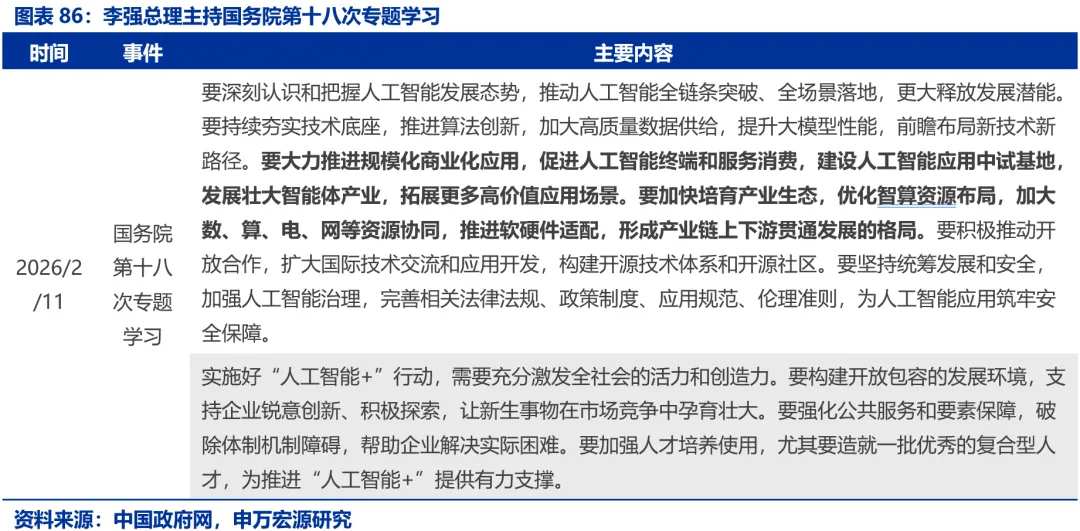
(7) State Council Special Study: Deepening and Expanding 'Artificial Intelligence+', Empowering All Industries Across the Board
On February 11, the State Council conducted its eighteenth special study session on the theme of 'Deepening and Expanding Artificial Intelligence+, Empowering All Industries Across the Board.' The special study meeting emphasized the comprehensive advancement of AI scientific innovation, industrial development, and application empowerment to cultivate new productive forces, specifying the need to push for breakthroughs across the entire AI value chain and implement full-scenario applications; strengthen the technical foundation by promoting algorithmic innovation, increasing the supply of high-quality data, and enhancing large model performance; advance scaled commercial applications through promoting terminal and service consumption, constructing pilot bases, and developing smart agent industries; and foster an industrial ecosystem by optimizing intelligent computing resource distribution, reinforcing digital and power grid collaboration, and advancing software-hardware compatibility.
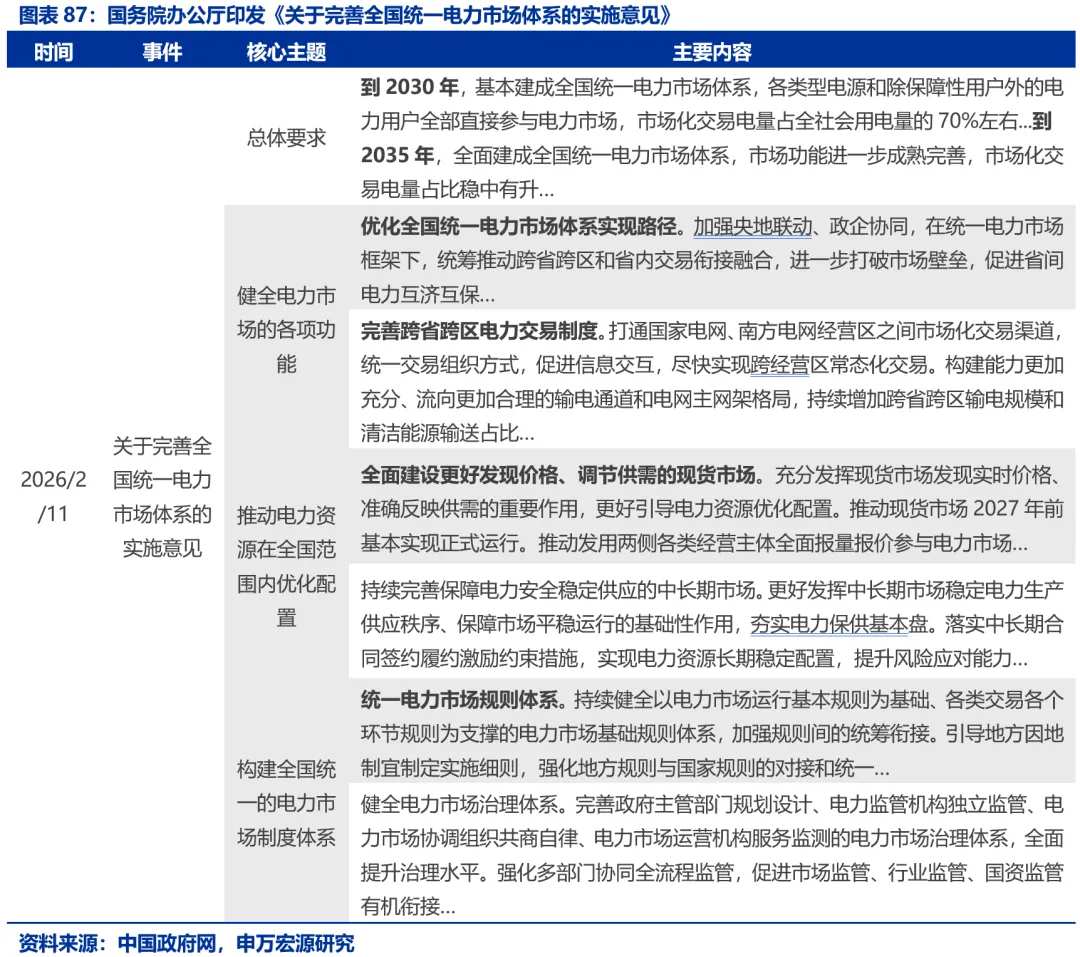
(8) General Office of the State Council: Improving the National Unified Electricity Market System
On February 11, the General Office of the State Council issued the 'Implementation Opinions on Improving the National Unified Electricity Market System,' aiming to deepen power system reform and improve market and price mechanisms related to the new energy system. The opinions specify that by 2030, the basic establishment of a national unified electricity market system will be completed, with market-based trading volume accounting for about 70% of total electricity consumption in society. By 2035, this system will be fully established. The document proposes promoting nationwide optimization of power resources, unblocking inter-provincial and cross-regional transaction channels within grid operating areas, and fostering integration between inter-provincial/cross-regional transactions and intra-provincial transactions. It also emphasizes enhancing diverse market functions including spot, medium- and long-term, auxiliary services, and green power markets, while establishing unified rules, governance, electricity pricing, technical standards, and credit systems. Strengthening policy coordination and organizational leadership will support energy security, economic and social development, and the transition towards green and low-carbon practices.
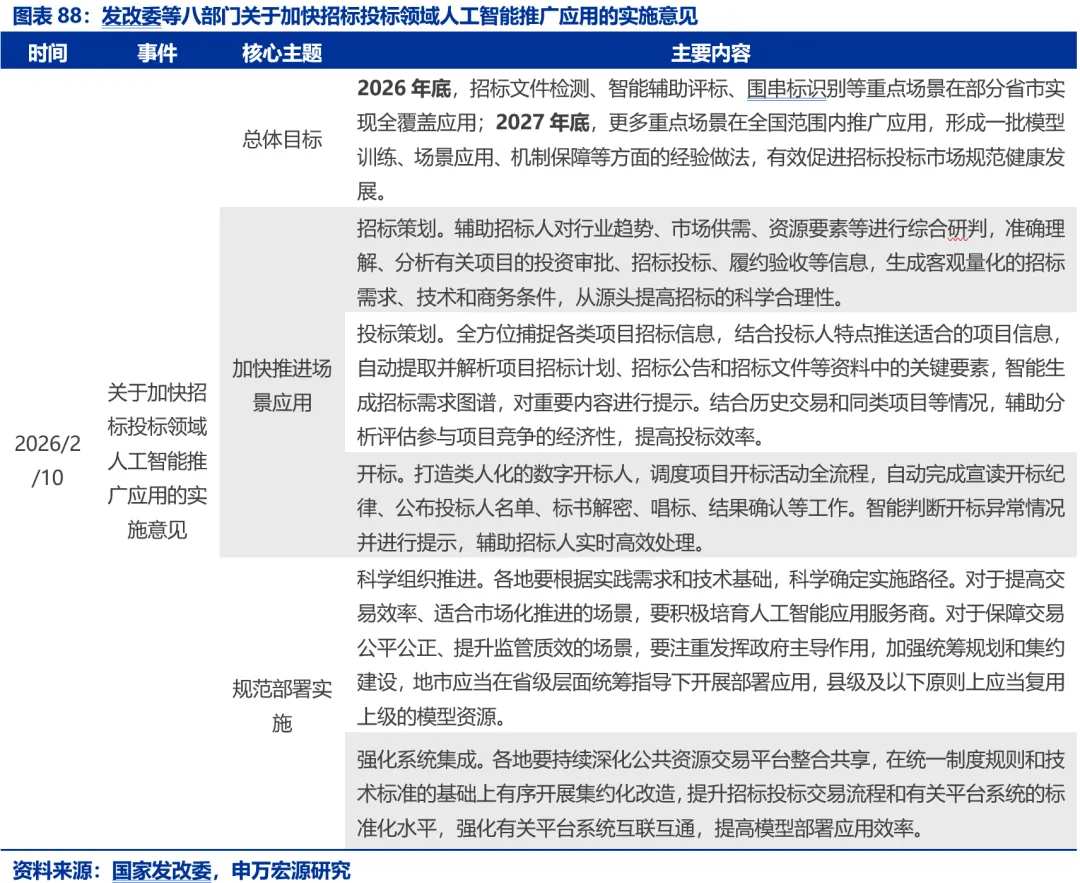
(IX) National Development and Reform Commission et al.: Accelerate the Promotion and Application of Artificial Intelligence in Bidding and Tendering Fields
On February 10, eight departments including the National Development and Reform Commission jointly issued the 'Implementation Opinions on Accelerating the Promotion and Application of Artificial Intelligence in Bidding and Tendering Fields.' This aims to promote the deep integration of bidding/tendering processes with artificial intelligence and regulate market order. According to the principle of 'government guidance, multi-party participation, scenario-driven, and secure controllability,' the opinions specify that by the end of 2026, key scenarios such as tender document detection, intelligent assisted bid evaluation, and collusion identification will achieve full coverage in selected provinces and cities, with nationwide application targeted by the end of 2027. The document outlines twenty specific use-case scenarios across six categories: 'Artificial Intelligence+' in bidding, tendering, opening bids, evaluating bids, finalizing bids, site management, and supervision. Additionally, it mandates scientifically organized implementation, strengthened system integration, solid data foundations, technology-assisted positioning, and enhanced safety levels.
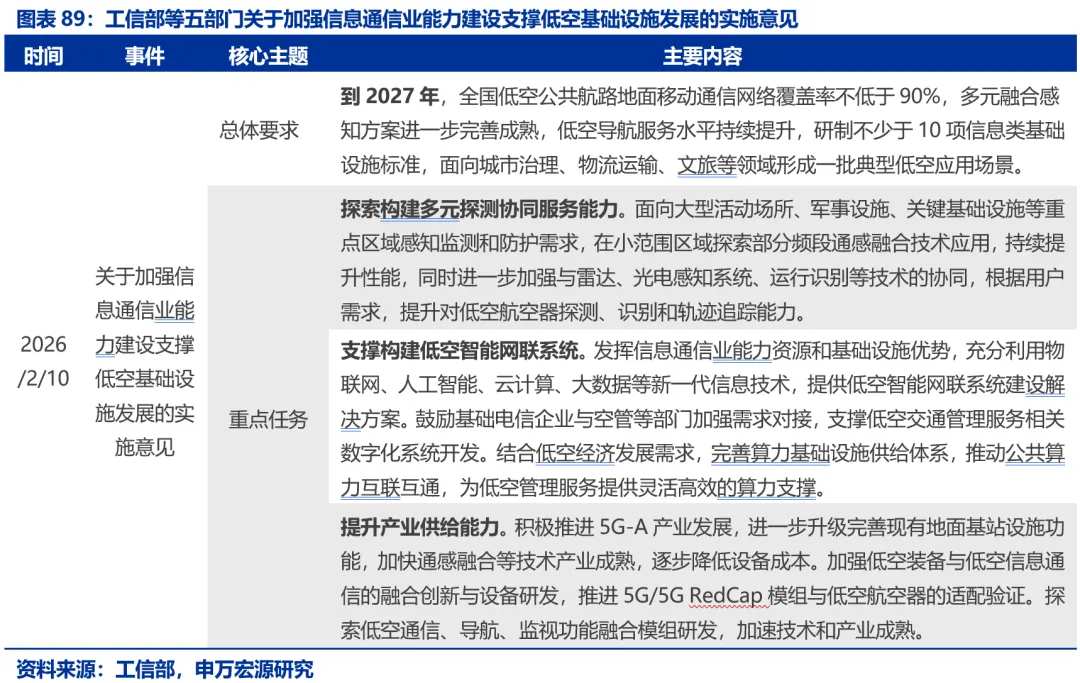
(X) Ministry of Industry and Information Technology et al.: Enhance ICT Support for Low-Altitude Infrastructure
On February 10, five departments including the Ministry of Industry and Information Technology jointly issued the 'Implementation Opinions on Strengthening ICT Capability Construction to Support the Development of Low-Altitude Infrastructure.' The objective is to reinforce ICT's role in supporting low-altitude infrastructure, promote healthy growth in the low-altitude economy, and foster new forms of productivity. Following the principles of 'demand-driven, resource-efficient reuse, pilot projects first, and secure controllability,' the opinions propose achieving no less than 90% ground mobile communication network coverage for national low-altitude public air routes by 2027, developing at least ten information infrastructure standards, and creating several typical low-altitude application scenarios. Key deployments include advancing low-altitude communication network coverage based on demand, constructing multi-source detection and cooperative service capabilities, among others.
On February 13, the Ministry of Industry and Information Technology convened an all-members meeting of the Leading Group for Low-Altitude Industry Development. The meeting proposed increasing policy support for innovation in the low-altitude industry, accelerating preliminary standard research, and establishing a comprehensive industrial standard system. The meeting emphasized that during the 'Fifteenth Five-Year Plan' period, it is crucial to fully recognize the new situation facing China’s low-altitude industry development, ensuring steady progress towards safe, orderly, and healthy growth. Efforts should focus on reinforcing safety foundations, strengthening manufacturing industry oversight, paying significant attention to low-altitude radio security, cybersecurity, and data security, and building a test and validation system for low-altitude equipment. Moreover, there should be an emphasis on tackling fundamental common technologies within the sector, accelerating AI empowerment, expanding application scenarios methodically, upgrading equipment driven by real-world applications, deepening high-level international cooperation, and consolidating the talent pool to provide robust support for strategic emerging industries in the low-altitude economy.
This article mainly organizes data and events without updating viewpoints. Comments mentioned in the text are restatements of perspectives from previous reports.
Risk Warning
1. Escalation of geopolitical conflicts. The Russia-Ukraine conflict has yet to conclude, and geopolitical tensions may intensify volatility in crude oil prices, disrupting the global disinflation process and expectations for a soft landing.
2. U.S. economic slowdown exceeds expectations. Attention should be paid to the risks of weakening employment and consumption in the United States.
3. The Federal Reserve shifts to a more hawkish stance than expected. If U.S. inflation demonstrates greater persistence, it could impact the pace of future interest rate cuts by the Federal Reserve.
Editor/Rocky