
Changjiang Securities reviewed half a century of six Middle East conflicts and pointed out that the 'surge' in oil prices has never followed the intensity of the war, but rather depends on the severity of supply disruptions, the speed of alternative supplies, and whether inflation expectations can be re-anchored. From the six conflicts, supply shocks typically bottom out in about 1 to 3 months, and oil prices usually peak in about 2 to 4 months. The Federal Reserve's actions depend on whether the inflation level is high and whether inflation expectations are unanchored at the time.
Placing nearly half a century of Middle East-related conflicts on a timeline shows that the 'surge' in oil prices is not always linked to the intensity of the war but is more like a function of two factors: whether there is an actual supply disruption and whether the disruption can be quickly offset by other oil-producing countries, strategic reserves, or reduced demand. Changjiang Securities’ in-depth macro report breaks down the six conflicts and links the chain of oil prices, inflation, growth, the Federal Reserve, and asset trading. Reading this report is more useful than analyzing any single event in isolation.
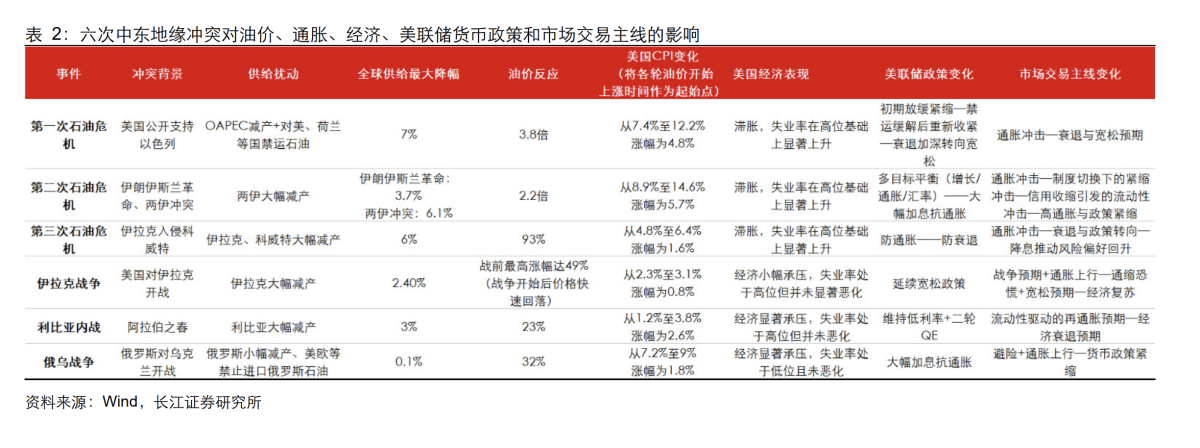
In the report, Changjiang Securities macro analyst Yu Bo straightforwardly wrote: 'The intensity of oil supply disruptions caused by geopolitical conflicts determines the magnitude of the oil price shock, while the ability to restore supply/replace it and potential demand determine the subsequent central level of oil prices.' This sentence essentially summarizes the 'discriminant' of the entire report: the starting point of the shock depends on supply disruptions, and whether the shock evolves into a long-term issue depends on recovery and substitution.
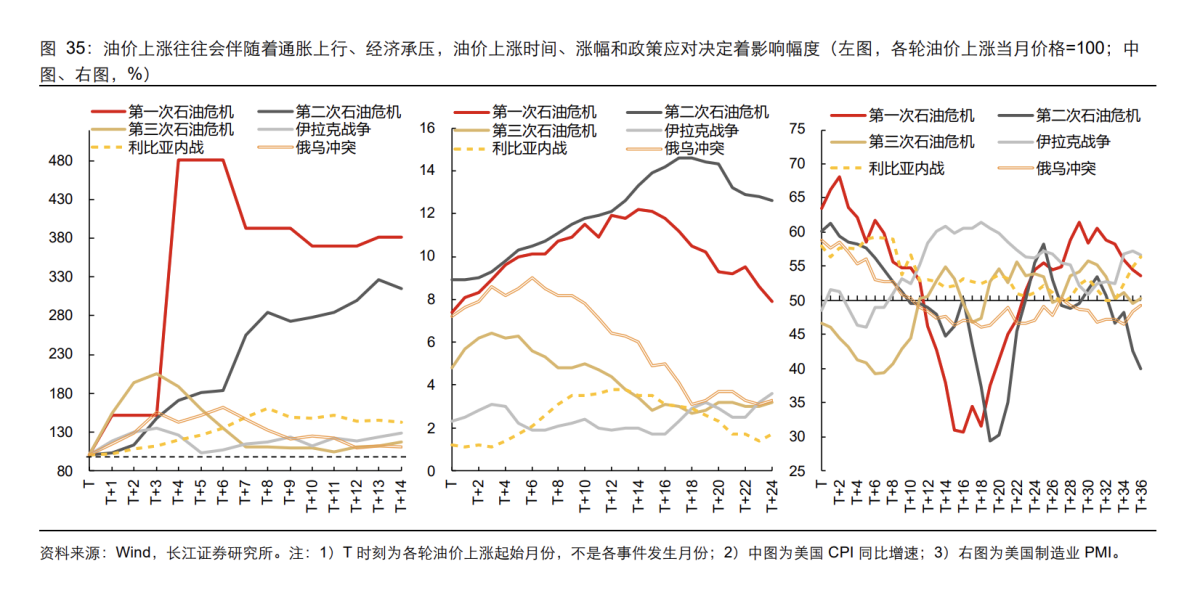
 The historical division is also clear. During the two oil crises of the 1970s, oil prices increased multiple-fold and dragged the U.S. into stagflation; whereas during the 1990 Gulf War, the 2003 Iraq War, and the 2011 Libyan Civil War, although oil prices rose, they were more prone to retreat after supply was hedged or expectations materialized. By the 2022 Russia-Ukraine conflict, the rise in oil prices coincided with 'high inflation constraints,' resulting not in easing policies to support growth but in a reinforcement of tightening logic.
At the trading level, the main theme often shifts from 'inflation/re-inflation' to 'stagnation' (growth slowdown/recession), but the Federal Reserve’s actions do not follow a fixed script—the key factor is whether the inflation level is high and whether inflation expectations are unanchored at the time. The report also provides several timeframes: supply shocks typically bottom out in about 1 to 3 months, oil prices usually peak in about 2 to 4 months, while the peaking or bottoming of inflation and PMI depends more on how long oil prices remain elevated and which side policy ultimately supports.
The extent of oil price increases is not determined by 'how big the conflict is,' but rather by 'how severe the supply disruption is.'
The report quantifies 'supply disruptions' very intuitively.
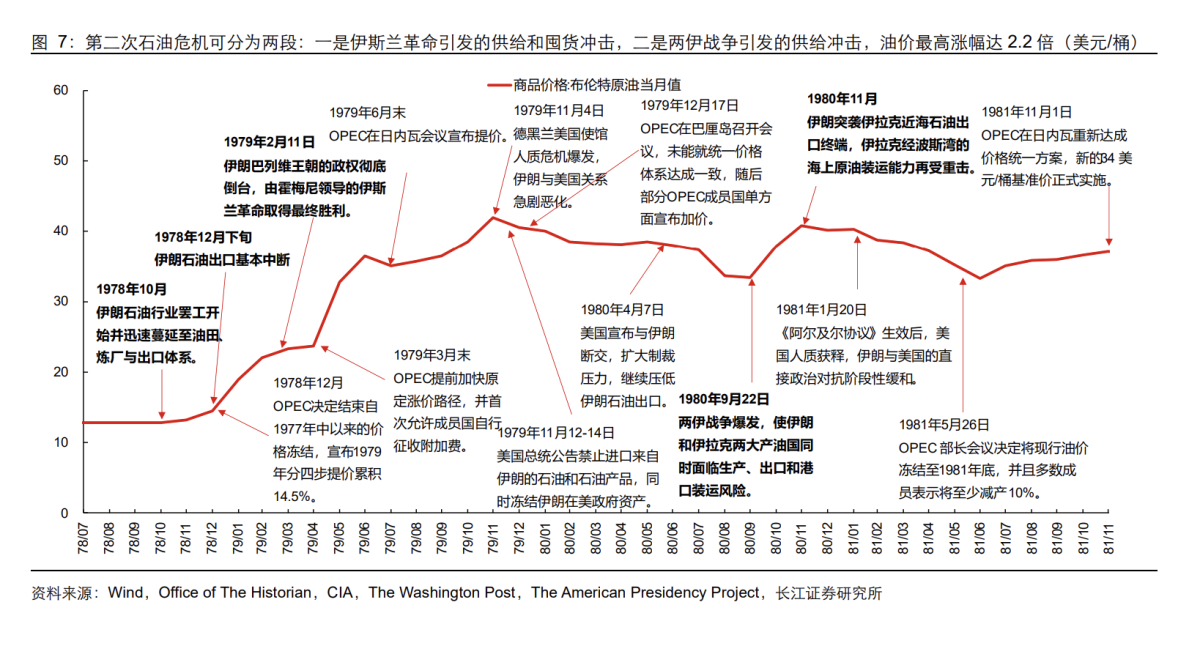
During the first oil crisis, Arab oil-producing countries’ 'production cuts + embargo' reduced global crude oil production by up to 6.7% compared to pre-war levels. Based on global consumption at the time, the demand gap reached 6.9%, and oil prices surged by up to 3.8 times. The second oil crisis can be divided into two phases: during the Islamic Revolution combined with stockpiling impacts, Iran’s production plummeted by 88% from 6.09 million barrels per day to 730,000 barrels per day, causing global production to decline by 3.7%; during the Iran-Iraq War phase, global production fell another 6.1%, with the demand gap estimated at 5.6%, and oil prices surged by up to 2.2 times.
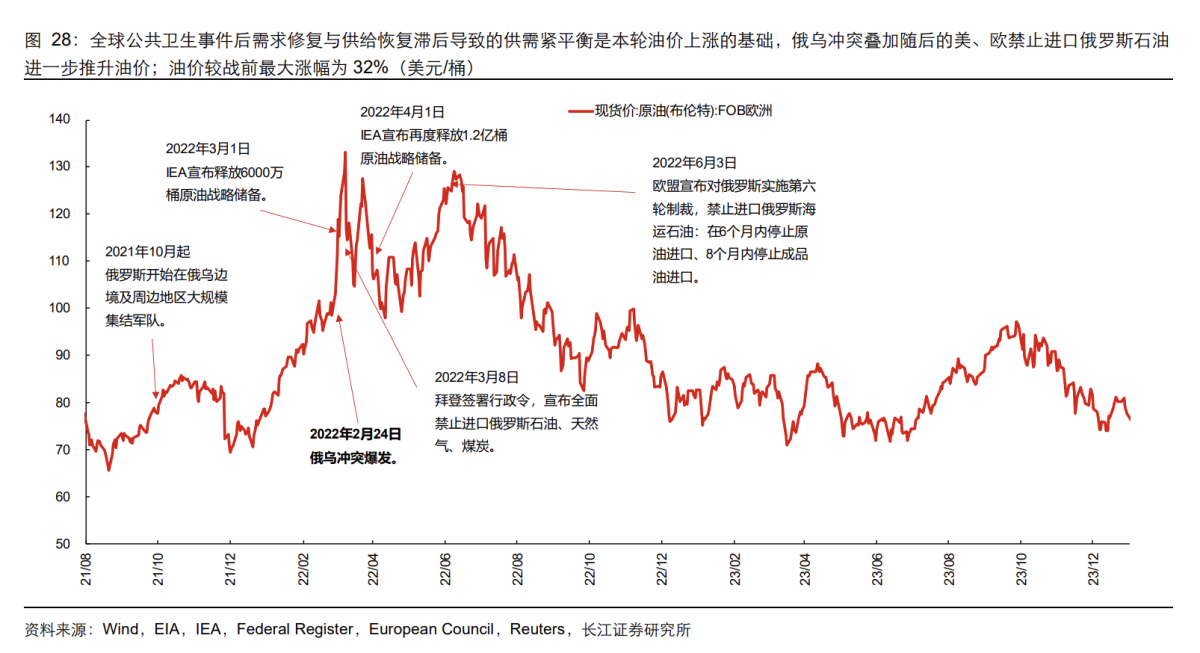
In contrast, the 'hard supply disruptions' during later conflicts were significantly easier to offset. For example, during the 2003 Iraq War, the report recorded a maximum global supply drop of only 2.4%; during the 2011 Libyan Civil War, global crude oil production fell by a maximum of only 3%. The Russia-Ukraine conflict was even more extreme: despite risk premiums being driven up by policies such as 'banning Russian oil imports,' the report estimated that global crude oil production fell by a maximum of only 0.1%, with oil prices rising by a maximum of 32% compared to pre-war levels.
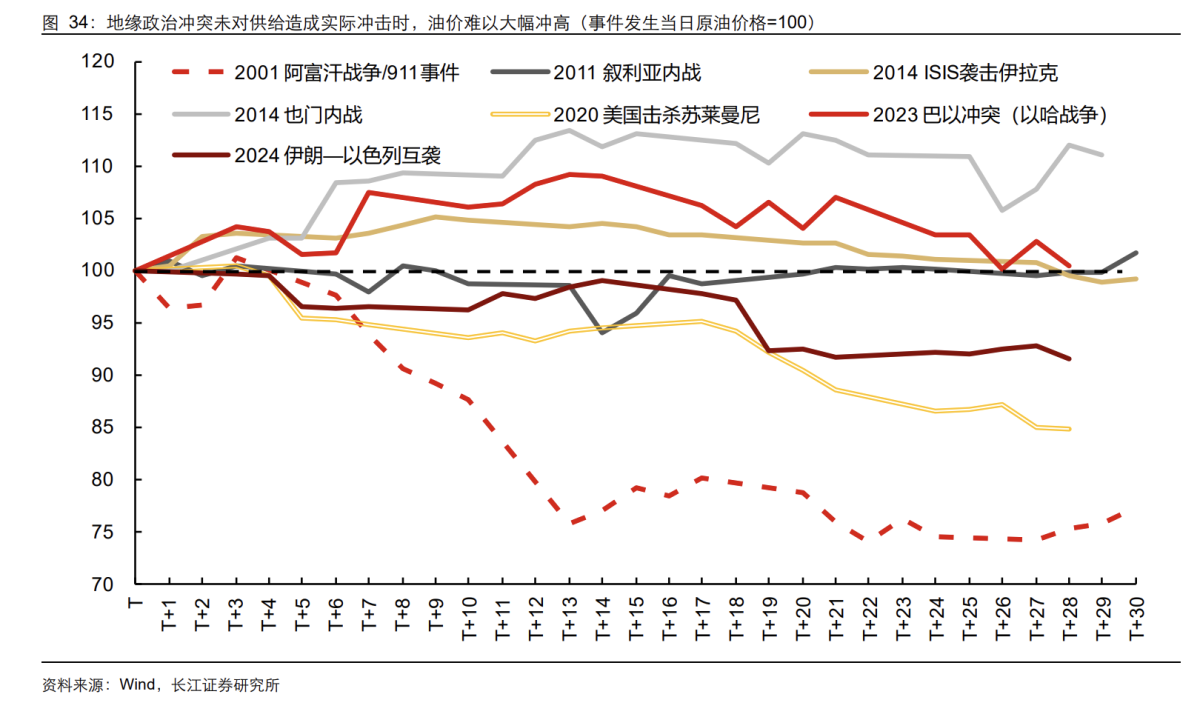
This also explains a point repeatedly emphasized in the report: when no substantial supply gap forms, the reaction of oil prices to geopolitical conflicts is more like the emotional pricing of 'potential supply risks,' and prices often retreat during the verification process showing that 'supply was not impaired.' The report lists these sentiment-driven events separately in a table, including the 2001 Afghanistan War/9·11, the 2011 Syrian Civil War, the 2014 ISIS attack on Iraq, the Yemeni Civil War, the 2020 U.S. killing of Soleimani, the 2023 Israel-Palestine conflict, and the 2024 Iran-Israel mutual attacks. The core commonality is that markets initially trade on the worst-case scenario, but if real supply is not severely disrupted, oil prices struggle to undergo 'sustained revaluation.'
The First and Second Oil Crises: What truly dragged the U.S. into stagflation was the de-anchoring of expectations.
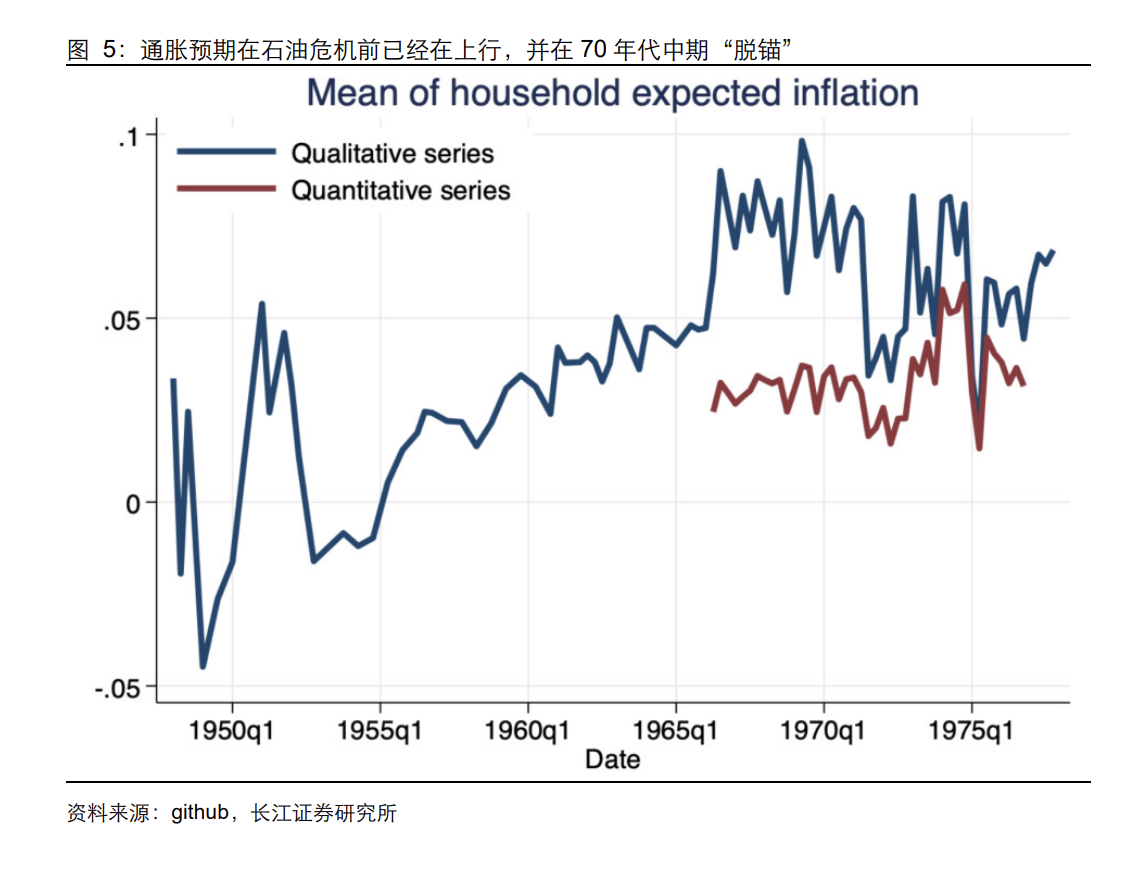
A frequently overlooked detail in reports on the first oil crisis is that the oil crisis was not the starting point of U.S. inflation. Prior to October 1973, U.S. inflation was already on the rise, driven by loose monetary policy and fiscal expansion that caused overheated demand, compounded by factors such as the collapse of the Bretton Woods system, rising food prices, and the lifting of price controls. The embargo acted more like an “amplifier,” pushing existing inflationary pressures into an even more unmanageable range. The corresponding policy response was not erratic shifts between tightening and loosening: it initially slowed tightening, then resumed tightening after the embargo eased, and shifted back to easing as the recession deepened.
The key aspect of the second oil crisis was the “deterioration of expectation mechanisms.” The report makes clear the turning point during the Volcker era: the real danger was not just the level of oil prices, but how high oil prices reinforced inflation persistence through the “wage-cost-price” chain and expectation mechanisms, leading markets to question the ability to fight inflation and the credibility of policies, which also pressured the dollar's credibility. Thus, the Federal Reserve’s response in October 1979 was not a mild rebalancing; instead, it shifted its policy framework to focus on “controlling money and credit, and rebuilding anti-inflation credibility,” allowing interest rates to fluctuate significantly.
When viewing these two crises together, the report essentially answers an old question: why did supply shocks in the 1970s evolve into long-term stagflation? The answer lies not only in “how much oil prices rose,” but also in whether inflation expectations at the time could be re-anchored.
1990, 2003: When supply can be substituted, oil prices tend to return to pre-war levels on their own.
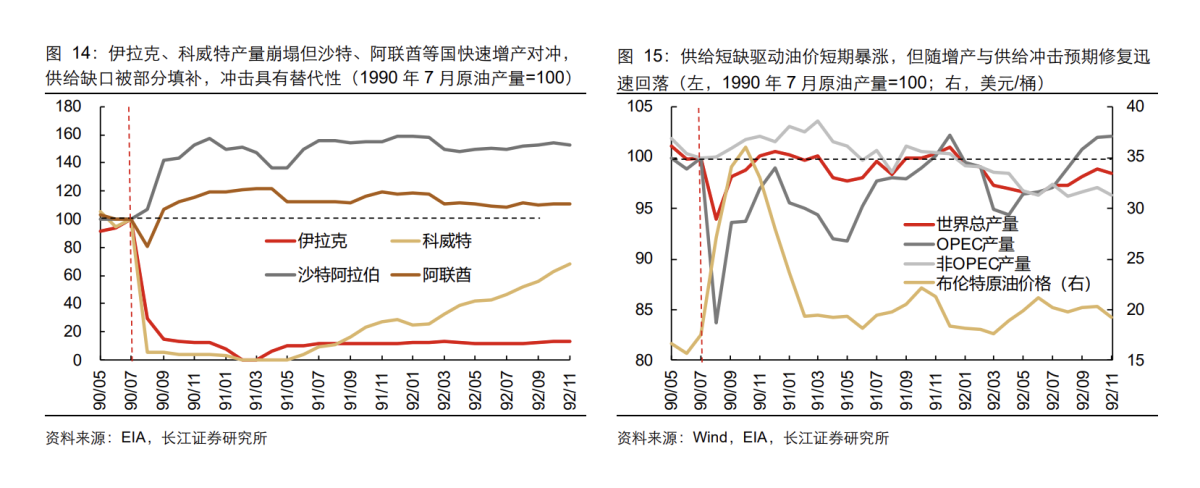
The third oil crisis (Gulf War) was not mild in terms of data: Iraq and Kuwait’s production dropped to zero, global crude oil production fell by 6%, the estimated demand gap was 5.5%, and oil prices surged by up to 93%. However, it did not lead to long-term stagflation because “hedges arrived quickly” — other oil-producing countries increased production, strategic petroleum reserves provided a buffer, and expectations of no further escalation of the war allowed oil prices to quickly fall back to near pre-war levels after peaking.
The macroeconomic outcome was also different: the report notes that U.S. CPI year-over-year temporarily rose from around 5% to about 6% before falling back. The Federal Reserve soon shifted its policy focus from preventing inflation to averting recession and accelerated the pace of rate cuts starting in October 1990.
The 2003 Iraq War was more like a lesson in “expectation management.” The report emphasizes that the main increase in oil prices occurred before the war (cumulative gains of about 30%-50% from November 2002 to February 2003), and the outbreak of the war became the inflection point for oil prices to peak and then retreat: rapid conflict progress, no expansion of the supply gap, and markets shifting from “pricing worst-case scenarios” to “risk realization.” At the macro level, the primary issue in the U.S. at the time was weak recovery and lagging employment following the bursting of the internet bubble, with core inflation remaining low. The Federal Reserve did not shift to tightening due to rising oil prices, but instead cut the federal funds rate to 1% in June 2003, maintaining it until mid-2004.
Looking at these two historical episodes together, the report’s message is not that “oil price shocks are not scary,” but rather: when supply substitution and policy tools can be implemented quickly, oil prices alone are unlikely to drag the macroeconomy into long-term imbalance.
Libya and Russia-Ukraine: Same rise in oil prices, but monetary policy background determines the 'consequences.'
During the Libyan civil war, the report attributed oil price movements to 'three forces': demand recovery providing a trend foundation, the second round of QE launched in November 2010 amplifying liquidity and inflation expectations, and geopolitical risks further increasing premiums. The maximum increase in oil prices from pre-war levels was 23%, but the global supply shock was relatively minor (with a maximum drop of only 3%).
More critically, the macroeconomic backdrop showed that the U.S. was still in the post-subprime crisis recovery phase, with persistently high unemployment rates, and inflationary pressures were mainly concentrated in energy components, while core inflation and long-term expectations remained relatively stable. The Federal Reserve's policy focus remained on stabilizing the economy and employment. Consequently, the dominant trading narrative shifted from 'liquidity-driven reflation' to 'weakening growth/recession expectations,' rather than inflation dominating everything.
The Russia-Ukraine conflict presented the opposite scenario. The report clarified that the basis for this round of oil price increases was the tight balance between supply and demand caused by post-pandemic demand recovery and lagging supply restoration, with the conflict and embargo further driving up oil prices (a maximum increase of 32% from pre-war levels). However, the macroeconomic constraint came from inflation: U.S. CPI year-over-year rose from 7.6% in January 2022 to a peak of 9.1% in June. Against this backdrop, the conflict did not push policies toward easing; instead, it compressed policy options – the Federal Reserve initiated tapering in November 2021, began raising interest rates in March 2022, and cumulatively raised rates by 425 basis points within the year. Market trading logic also quickly shifted from 'risk aversion and inflation shocks' to 'monetary policy tightening.'
This comparison is harsh: rising oil prices themselves do not automatically determine the Federal Reserve’s next move; the Fed focuses on inflation levels and expectation constraints, not news headlines.
It is common for trading to shift from 'inflation' to 'stagnation,' but the Federal Reserve does not necessarily cooperate.
The report identified the transition 'from inflation to stagnation' as a common feature across various rounds of shocks: initially, markets often trade on inflation and risk aversion (oil, gold, the U.S. dollar, or U.S. Treasuries), followed by visible growth pressures, shifting the trading focus to recession and potential policy reversals. However, it also specifically noted that rising inflation and economic pressures do not necessarily mean that the Federal Reserve will definitely raise or lower interest rates – the context depends on whether inflation is high and whether expectations are unanchored at the time.
In terms of timing, the report provided several empirical benchmarks for direct comparison: supply shocks typically bottom out after about 1–3 months, while oil prices generally peak around 2–4 months; in cases where oil prices peaked after approximately 3–6 months (the third oil crisis, the Iraq War, and the Russia-Ukraine conflict), U.S. inflation also tended to peak within 3–6 months; in instances where oil prices remained elevated and plateaued beyond 6 months (the first and second oil crises, as well as the Libyan civil war), inflation peaks were delayed to 12–18 months. The bottoming of the manufacturing PMI was more dependent on policy conditions: when oil price spikes were short-lived and monetary policy leaned toward easing to stabilize the economy, the PMI bottomed out in about 5–6 months; when oil prices surged for extended periods or policy was tight, the PMI bottoming process could extend to 16–20 months.
The final risk warning in the report merits careful consideration: historical experience itself has limitations, and the transmission mechanisms from oil prices to inflation and the economy vary depending on factors like energy intensity, wage-price dynamics, expectation anchoring, and policy credibility. Attributing the Federal Reserve's responses solely to oil prices and inflation/growth may overlook policymakers’ philosophies, internal disagreements, and external constraints. Asset prices are driven by multiple overlapping factors, making retrospectives prone to 'over-attribution.'
In other words, what this report offers is a more rigorous framework for analysis: first assess supply disruptions, then evaluate alternatives and recovery, and finally integrate inflation levels and expectation states into the same framework – if these four steps are incomplete, the market’s initial reaction to oil prices often reflects sentiment alone.
Editor/Melody