
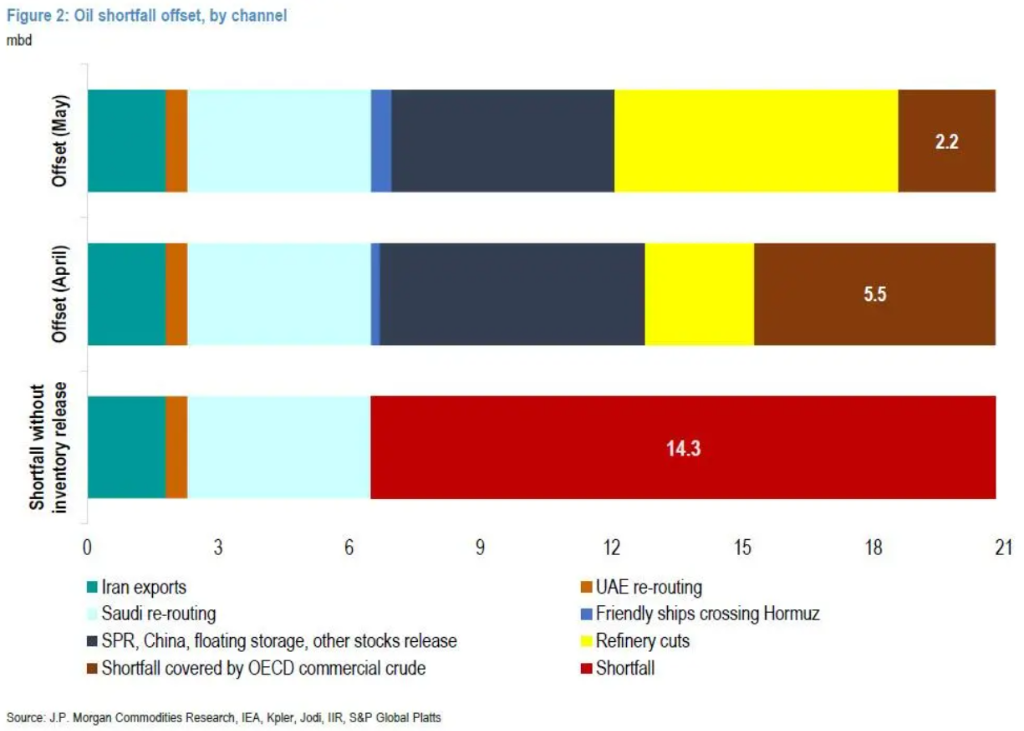
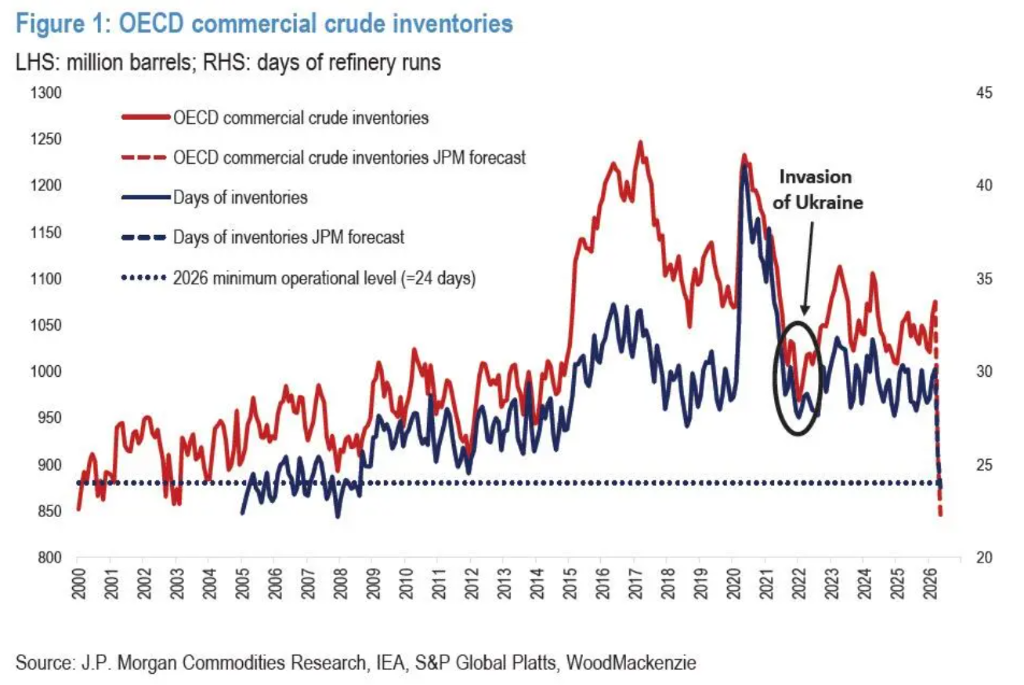
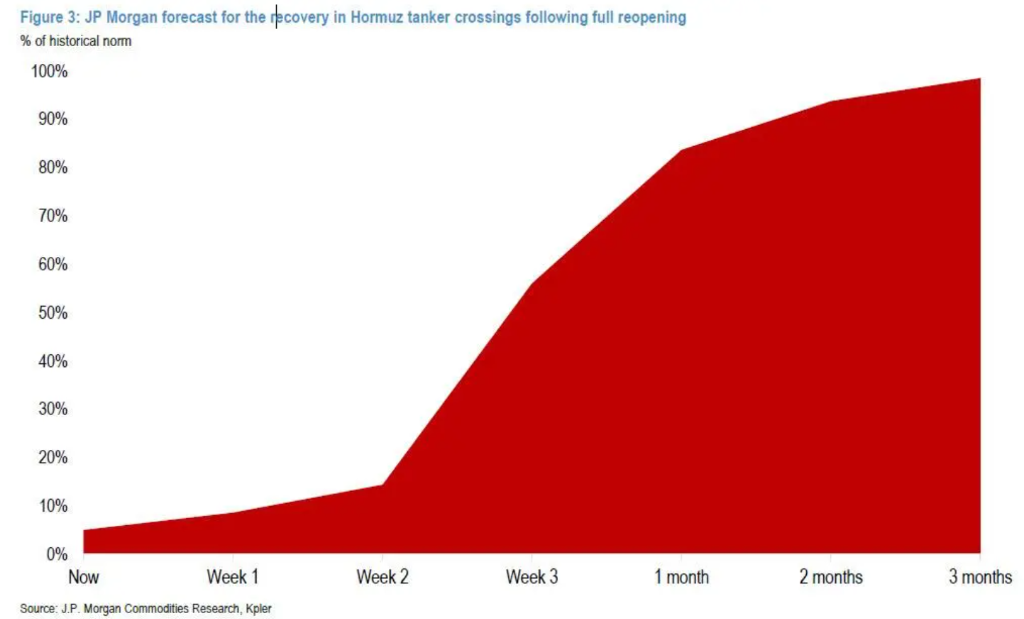
JPMorgan analysts estimate that the blockade of Hormuz will result in a global effective supply loss of approximately 14 million barrels per day. The OECD commercial crude oil inventory will deplete by 166 million barrels in April and an additional 67 million barrels by early May, reaching an "operational minimum" of 842 million barrels—beyond which prices, rather than inventory, will become the primary market balancing mechanism. Even if the strait reopens, supply recovery will proceed in three stages and take about four months.
When will global crude oil inventories "hit bottom"? JPMorgan has calculated a countdown curve.
In early April, JPMorgan commodity analyst Natasha Kaneva released a new report systematically calculating the depletion rate of global crude oil inventories under the impact of a Hormuz Strait blockade. A comprehensive timeline from "bottoming out" to "rebuilding" was provided. The conclusion is direct: the inventory buffer is being rapidly depleted, and the market is not far from the "operational minimum"—a potential bottom may occur in May.
What is the "operational minimum," and why is it a red line?
 To understand this report, one must first grasp a key concept: the operational minimum.
This represents the functional baseline of inventory, not a physical "emptying." Kaneva defines it as the level at which OECD commercial inventories can cover approximately 30 days of forward refinery demand, corresponding to about 842 million barrels.
Below this level, issues will begin to arise with refinery scheduling, logistics coordination, and market liquidity. Theoretically, the system could stretch to 24 days of coverage (the engineering minimum), but that would imply severe operational stress and a collapse in market liquidity.
It is akin to the fuel gauge lighting up a warning—not empty, but low enough to risk stalling at any moment.
Once inventory approaches this threshold, prices, rather than inventory itself, will become the primary market balancing mechanism—meaning high oil prices will forcibly suppress demand, replacing inventory as the buffer.
Countdown: When will inventories bottom out? Possibly in May.
JPMorgan's calculations show that the scale of this shock far exceeds previous ones.
The blockade of the Strait of Hormuz resulted in a daily effective supply loss of approximately 14 million barrels (14 mbd). In comparison, when the Russia-Ukraine conflict erupted in February 2022, OECD commercial crude oil inventories had already dropped to about 968 million barrels, equivalent to only 27 days of forward refinery demand coverage, leaving them in a fragile state.
This shock is larger, with even thinner buffers. Kaneva’s calculation approach is as follows:
April: OECD commercial crude oil inventories depleted by approximately 166 million barrels.
Early May: A further depletion of approximately 67 million barrels.
Subsequently reaching an operational minimum of 842 million barrels.
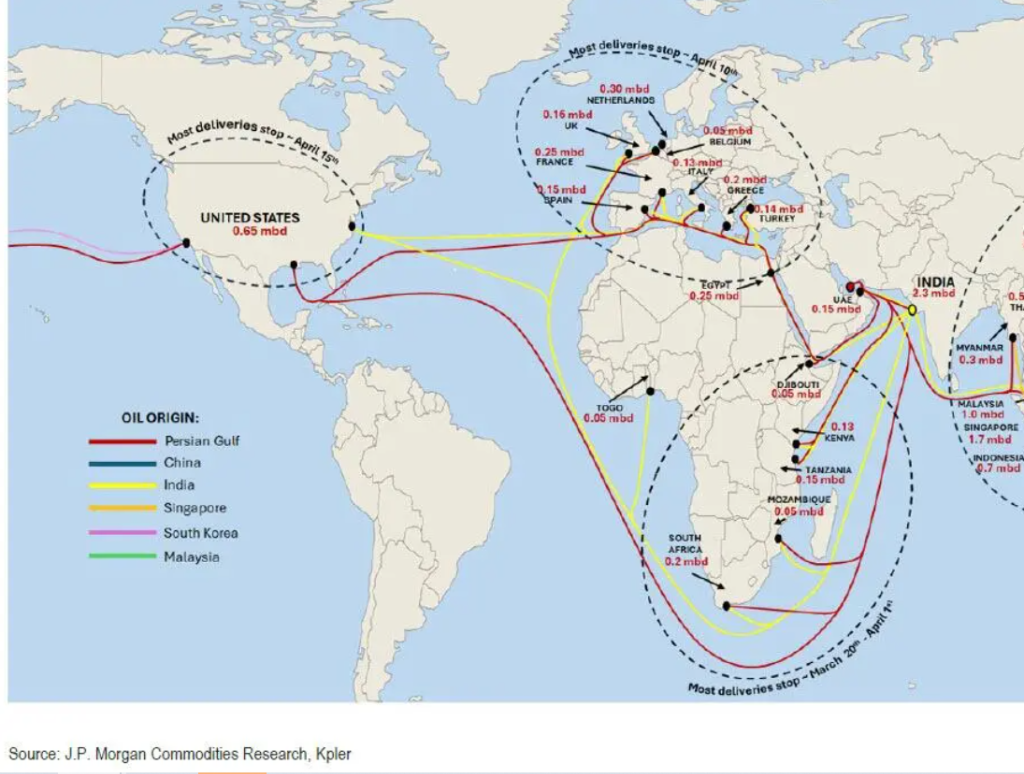
Pressure on the demand side has already become evident. The destruction of demand for middle distillates and aviation fuel in the Asian region has been the most pronounced, consistent with the geographic transmission path of the supply shock — buyers in Asia, being closest to the Persian Gulf, are the first to bear the pressure.
Supply Recovery: A Three-Phase Roadmap
Even if the strait were to reopen, supply would not immediately recover. JPMorgan has outlined three phases:
Phase One (Weeks 1–3): Cautious reopening, restoring approximately 6.3 million barrels per day — accounting for about half of the total halted production.
Even after a ceasefire agreement is reached, shipowners, port operators, and crew will still need to confirm safety before returning to the Persian Gulf. JPMorgan estimates that shipping companies will require about two weeks to verify that risks have dissipated.
Specific Timeline:
Week 1: Supply increases by 1.7 million barrels per day as producers cautiously resume operations to avoid abrupt surges.
Week 2: A further increase of 2.3 million barrels per day, with successful transit in Week 1 boosting confidence.
Week 3: An additional increase of 2.3 million barrels per day, as safety expectations stabilize and operational plans are progressively implemented.
High war risk premiums, congestion at loading and unloading ports, and priority buyers (especially in Asia) taking early delivery will all constrain the initial recovery pace.
Phase Two (Weeks 4-8): System normalization restores output to 29.3 million barrels per day.
By the end of the second month, Gulf supply recovers to 29.3 million barrels per day, still approximately 3.4 million barrels per day below pre-war levels.
Recovery progress varies by country:
Saudi Arabia: Near full recovery supported by scale advantages and alternative export routes.
United Arab Emirates: Recovery reaches 95%, with dynamics similar but still reliant on full operational restoration.
Iraq, Kuwait: Restored to approximately 80%, hindered by the shutdown and restart logistics of tank-driven oil fields. The southern export system of Iraq (Basra Oil Terminal, Khor Al-Amaya Port) has experienced multiple interruptions, with alternative routes (Kirkuk-Ceyhan) only partially compensating; guidance from Kuwait Petroleum Corporation (KPC) indicates that full recovery will take several months even after the cessation of hostilities.
Qatar: Restored to only 60%, with significant damage to Ras Laffan and related facilities. The repair cycle for LNG and associated liquids (condensate, NGL) could last several years. QatarEnergy has quantified losses for products such as condensate, liquefied petroleum gas, naphtha, sulfur, and helium.
Phase Three (Months 3-4): Bridging the production gap to restore to 99% of pre-war levels.
Month Three: Supply restored to 31 million barrels per day, still approximately 1.7 million barrels per day lower than pre-war levels.
Month Four: Overall restoration to approximately 99% of pre-war levels.
Saudi Arabia and the UAE will return to full production capacity by then. Iraq will recover to 90%, Kuwait to 80%, and Qatar to 77% – the latter constrained by damage to Ras Laffan/GTL infrastructure, with full repairs expected to take three to five years.
Iran represents another long-tail risk. Attacks on the South Pars gas field have impacted the condensate and NGL supply chains. Due to the highly integrated nature of gas processing, liquid recovery, and downstream petrochemical systems, the recovery of condensate and NGL production will lag behind upstream restarts. JPMorgan estimates that by the end of the fourth month, Iran's production will still be approximately 200,000 barrels per day lower than pre-war levels.
Inventory Rebuilding: How Much Longer?
Inventories will not rebound immediately following the restoration of supply.
JPMorgan estimates that OECD commercial inventories will begin to rebuild approximately two months after the reopening of the Strait. To return to normal levels sufficient to cover 30 days of refinery feedstock, an additional 150 to 200 million barrels will need to be replenished.
At a replenishment rate of 30 to 45 million barrels per month (approximately 1 to 1.5 million barrels per day), the complete inventory replenishment cycle would take about four months.
In other words, even if the strait were to reopen tomorrow, it would take approximately half a year for the global crude oil market to return to a truly normal state.
Editor/Melody